The Telemesure platform

One portal to see, be alerted and act

Telemesure brings the readings from your connected devices together in a web portal and a mobile app for Android and iPhone. You see the status of your devices at a glance, the right people are alerted according to your rules and schedules, and you can remotely control the devices that support it.

Screenshots of the Telemesure portal and app, demo data

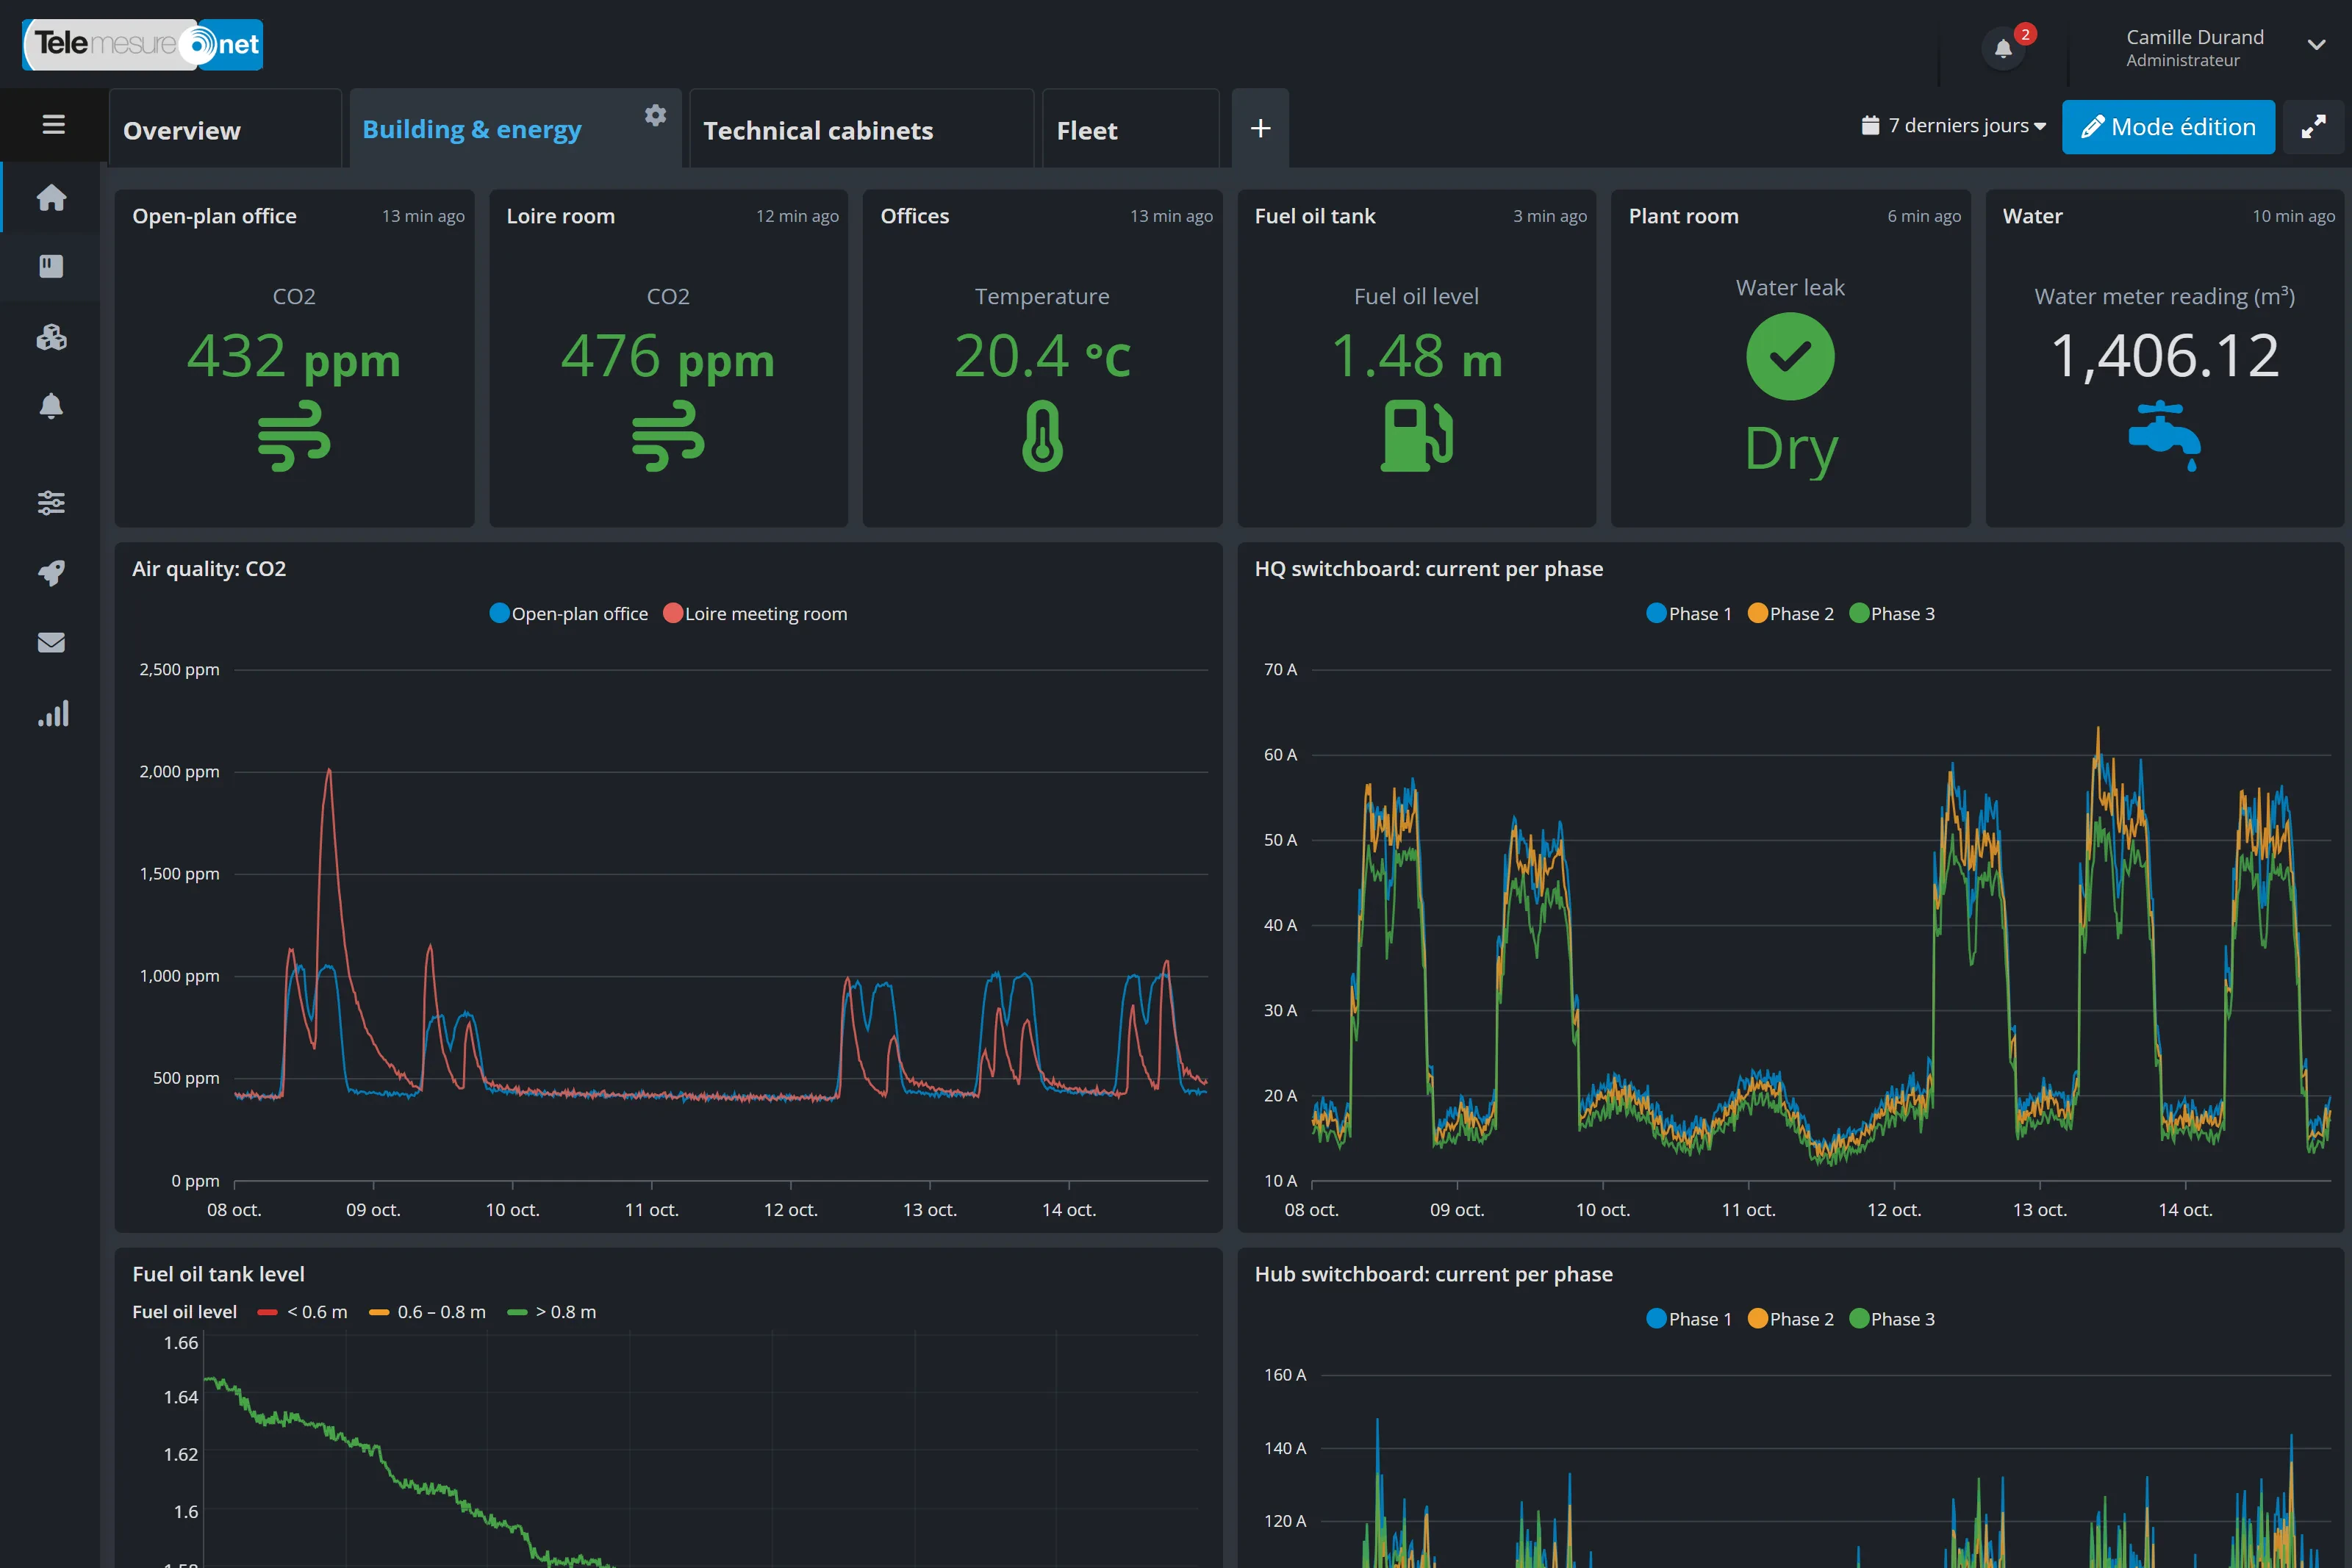
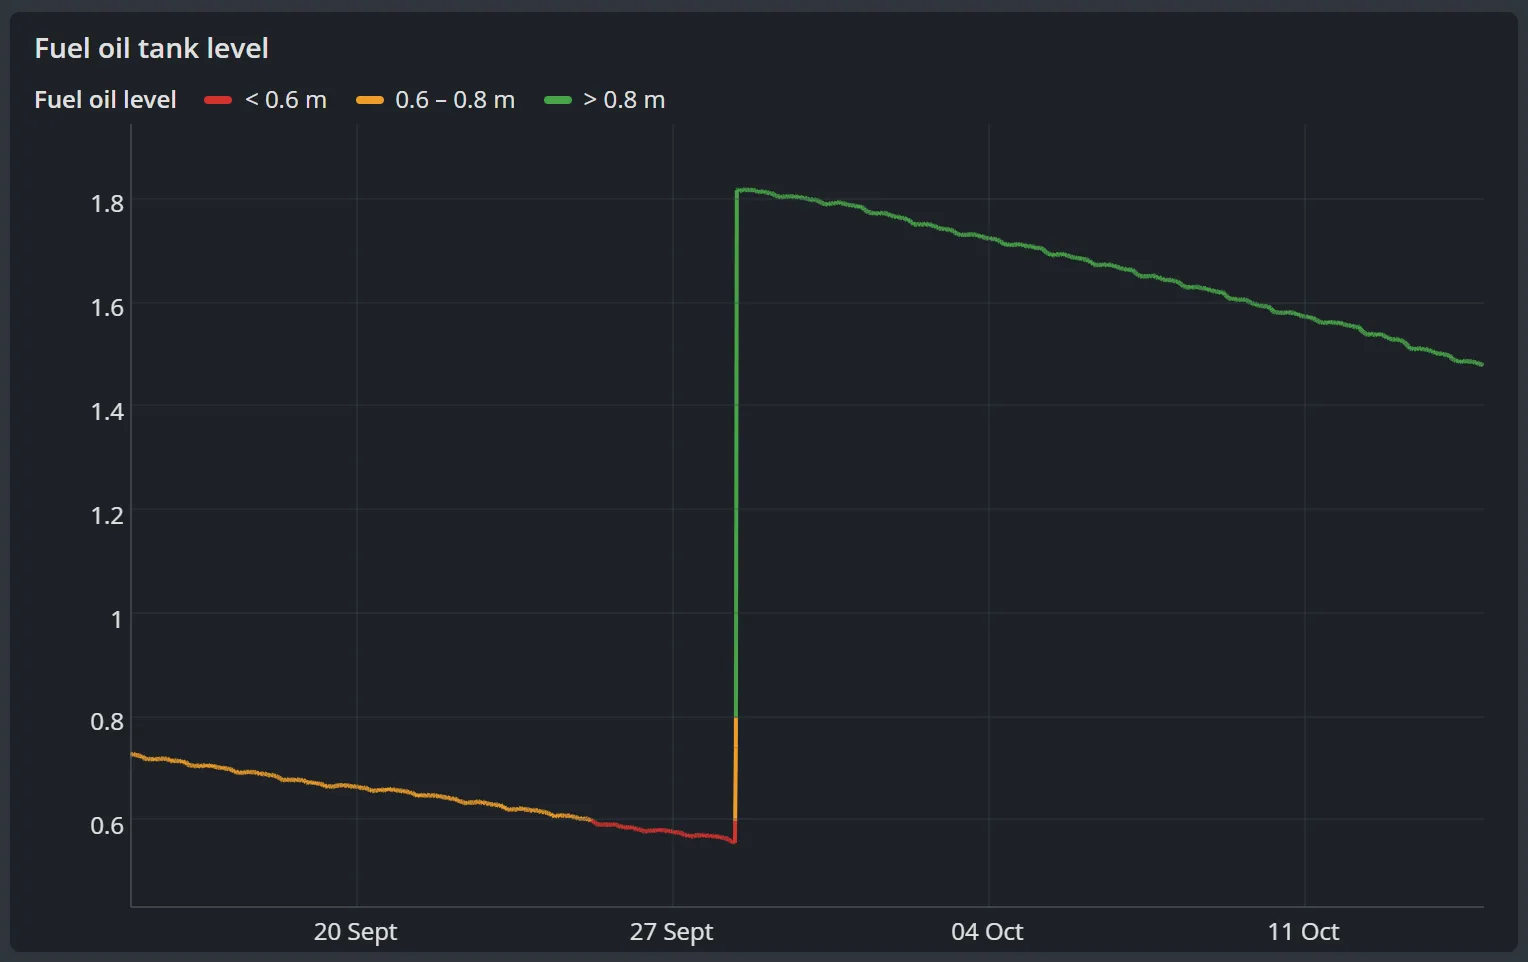
Enlarge the screenshot: The portal’s “Building & energy” dashboard in dark mode: CO₂ in the open-plan office and the meeting room, office temperature, heating-oil tank level, water leak detector and water meter reading, followed by charts of CO₂ and of the current per phase on the main switchboard over 7 days
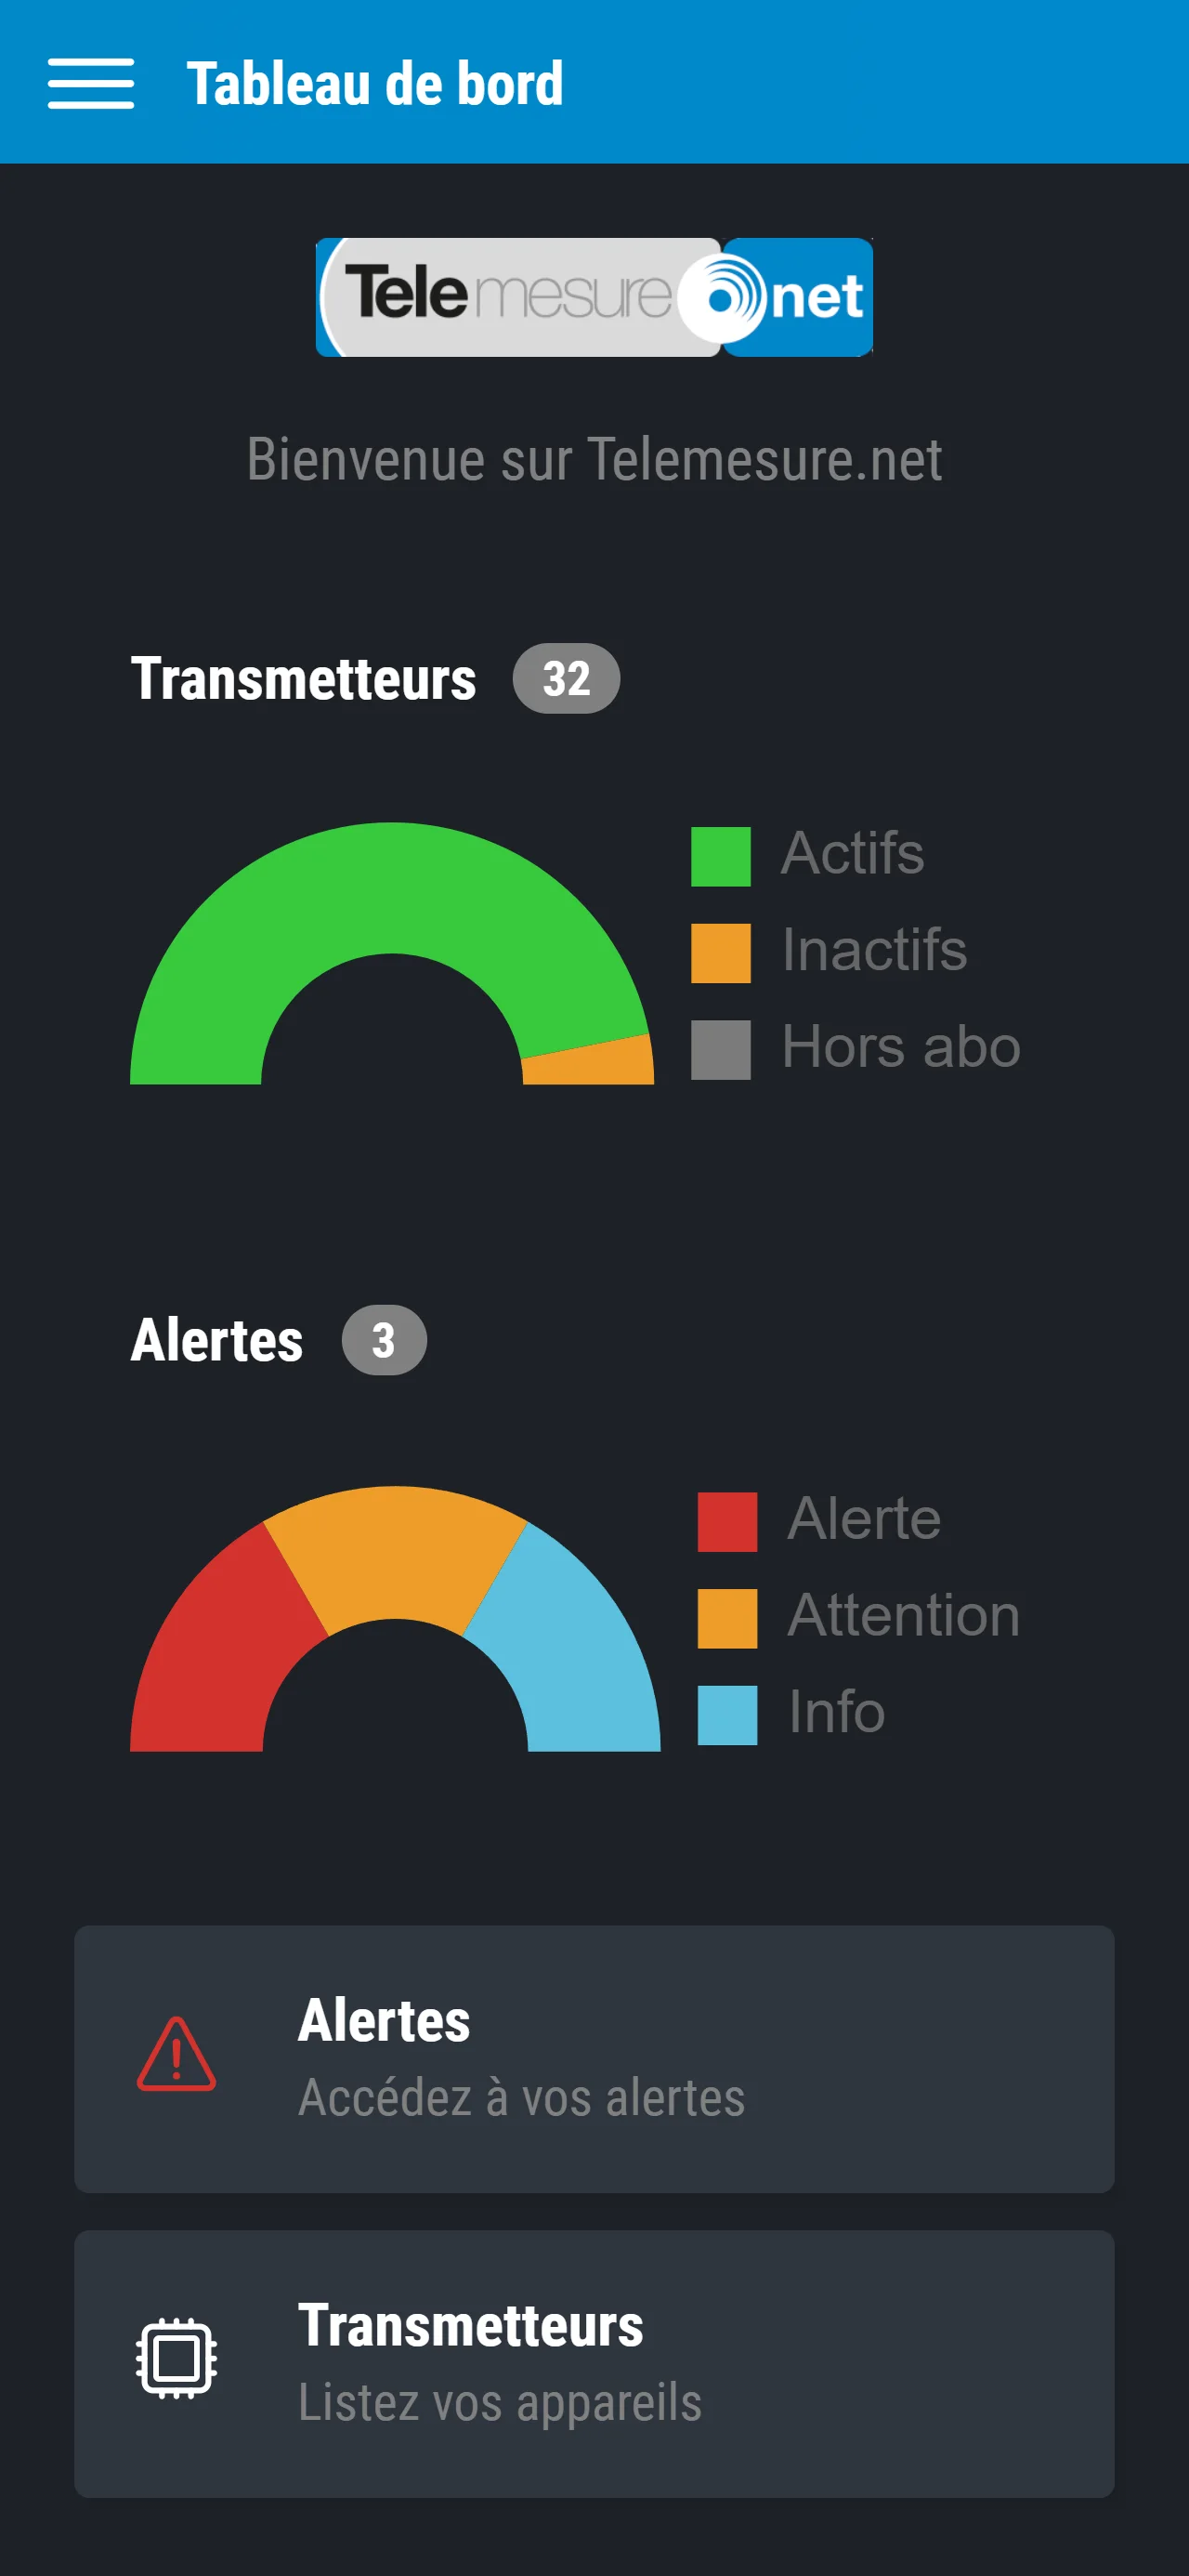
Enlarge the screenshot: The Telemesure mobile app, Dashboard screen: a gauge of the 32 transmitters, active in green and inactive in orange, a gauge of the 3 ongoing alerts by severity, and shortcuts to alerts and transmitters

Your devices at a glance

What’s working, what’s gone quiet, what needs your attention

The moment you sign in, the portal shows you what matters. Then every device has its place in a list, on a map and on its own page.

Portal home page

A home page that sums up the status of your devices

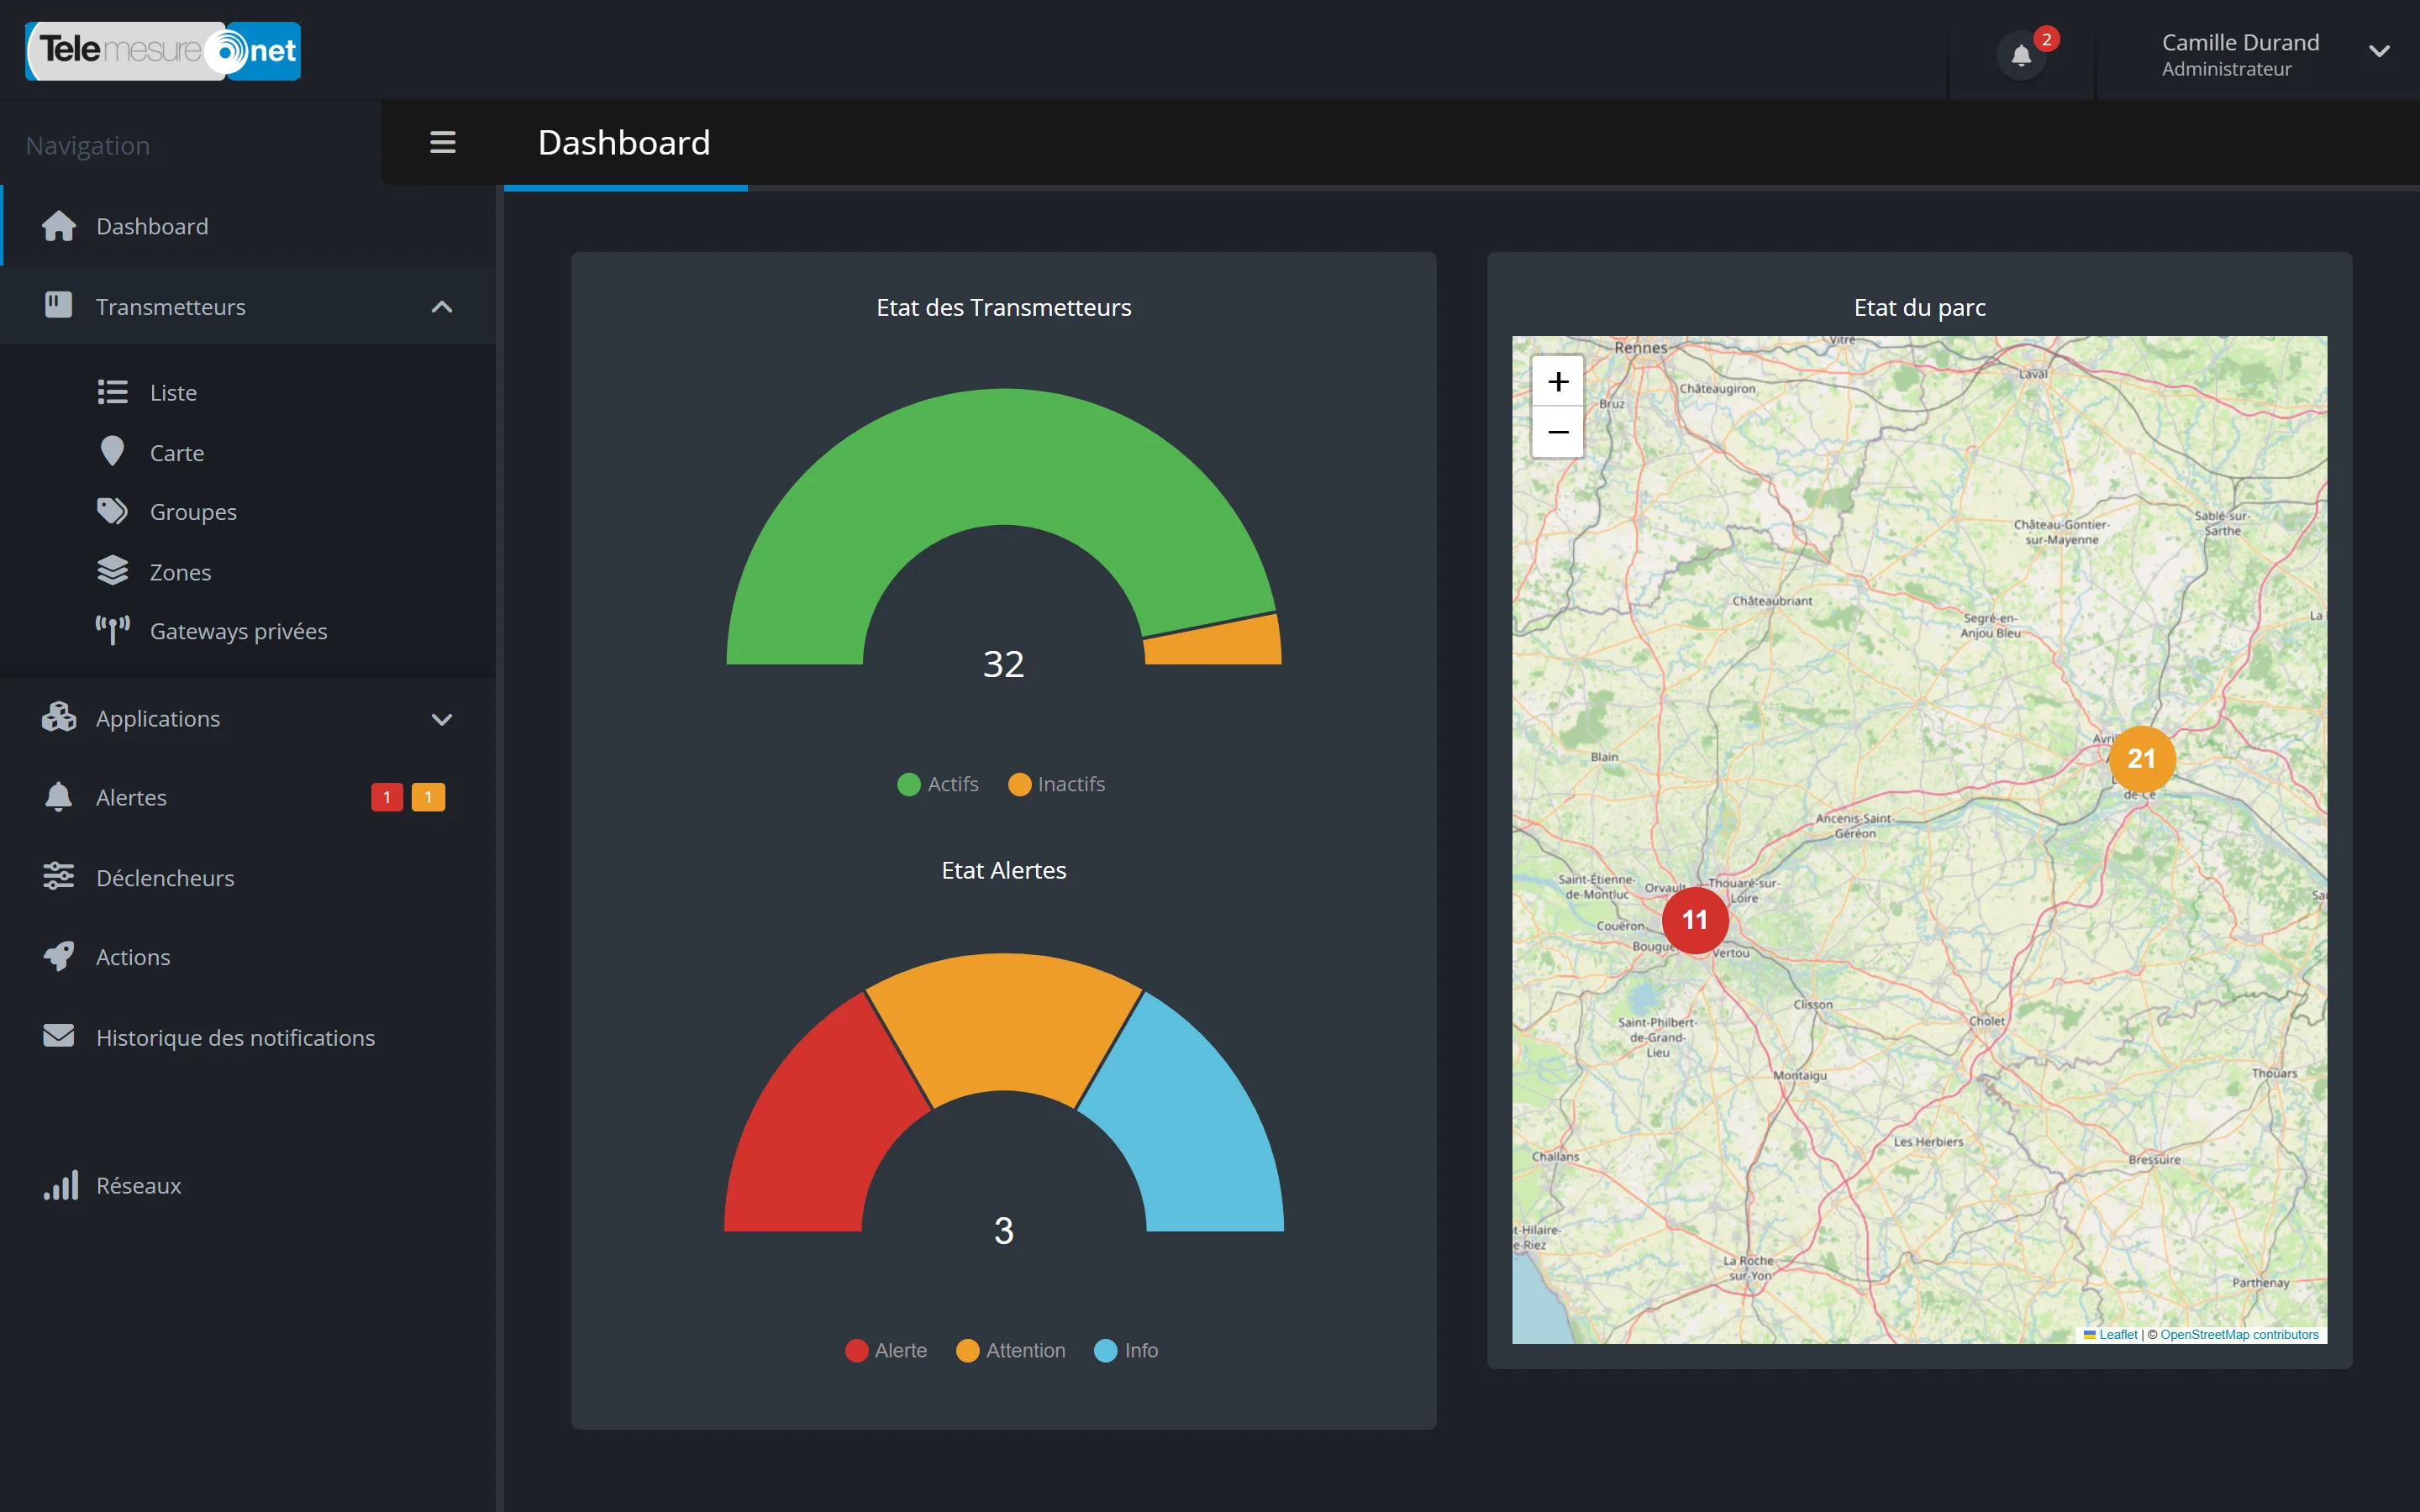
On the home page, you see how many devices are sending their data properly, how many have gone quiet or are inactive, and how many alerts are ongoing at each severity level.

A map shows your devices whose location is known, grouped together when they are close to each other.

  • A home screen in the same spirit on the mobile app
  • Your company logo on the portal
Enlarge the screenshot: Home page of the Telemesure portal in dark mode: a gauge of active and inactive connected devices, a gauge of ongoing alerts by severity (Alert, Warning, Info) and a map of your devices with two clusters, in Nantes and in Angers
The portal home page: active and inactive devices, ongoing alerts by severity and a map of your devices (demo data)

Device list

All your connected devices in a single list

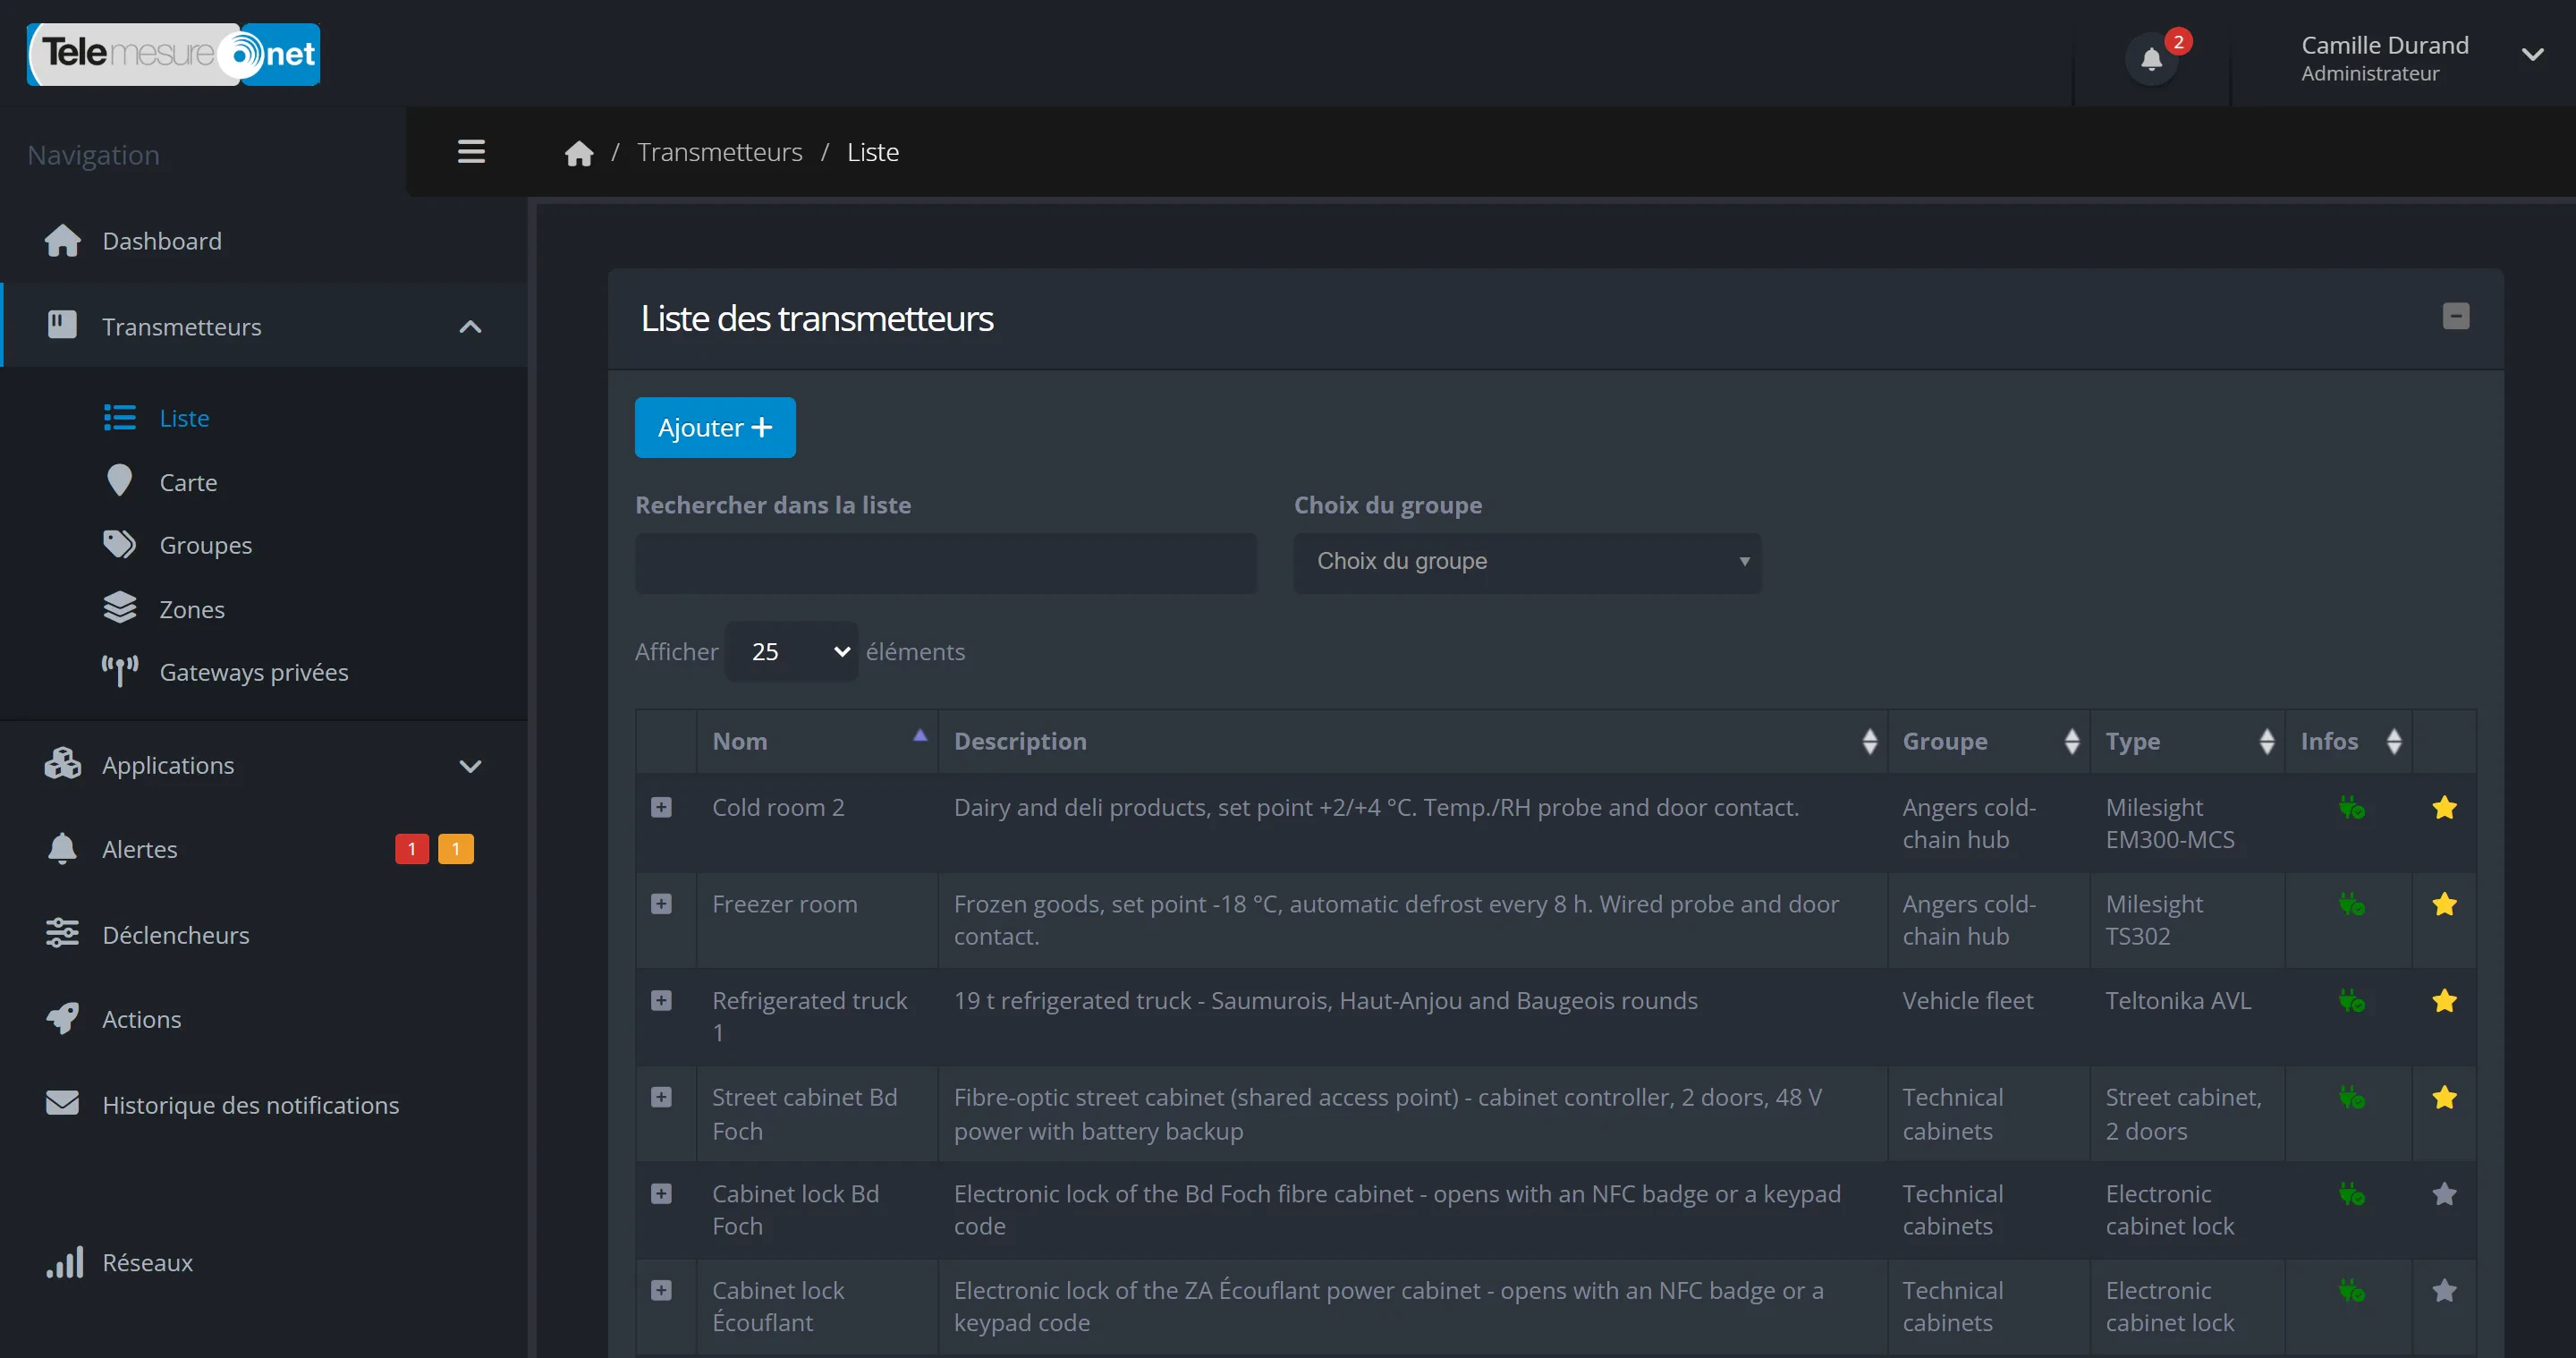
You search for a device by name, filter by group and mark your favourites. For each device, an icon shows whether it is sending its data properly, whether it has been silent for 24 hours or whether it is inactive.

  • Groups by site or by use, to filter your lists
  • The same groups restrict an alert rule, or the sending of its messages, to certain devices

In the portal, a device is called a “transmitter”.

Enlarge the screenshot: The portal’s transmitter list: a search box, a group selector, then for each device its name, description, group (Angers cold-chain hub, Vehicle fleet, Technical cabinets), model and its status and favourite icons
All your connected devices in a single list, filterable by group, with their model and status (demo data)

Device page

A page for every device

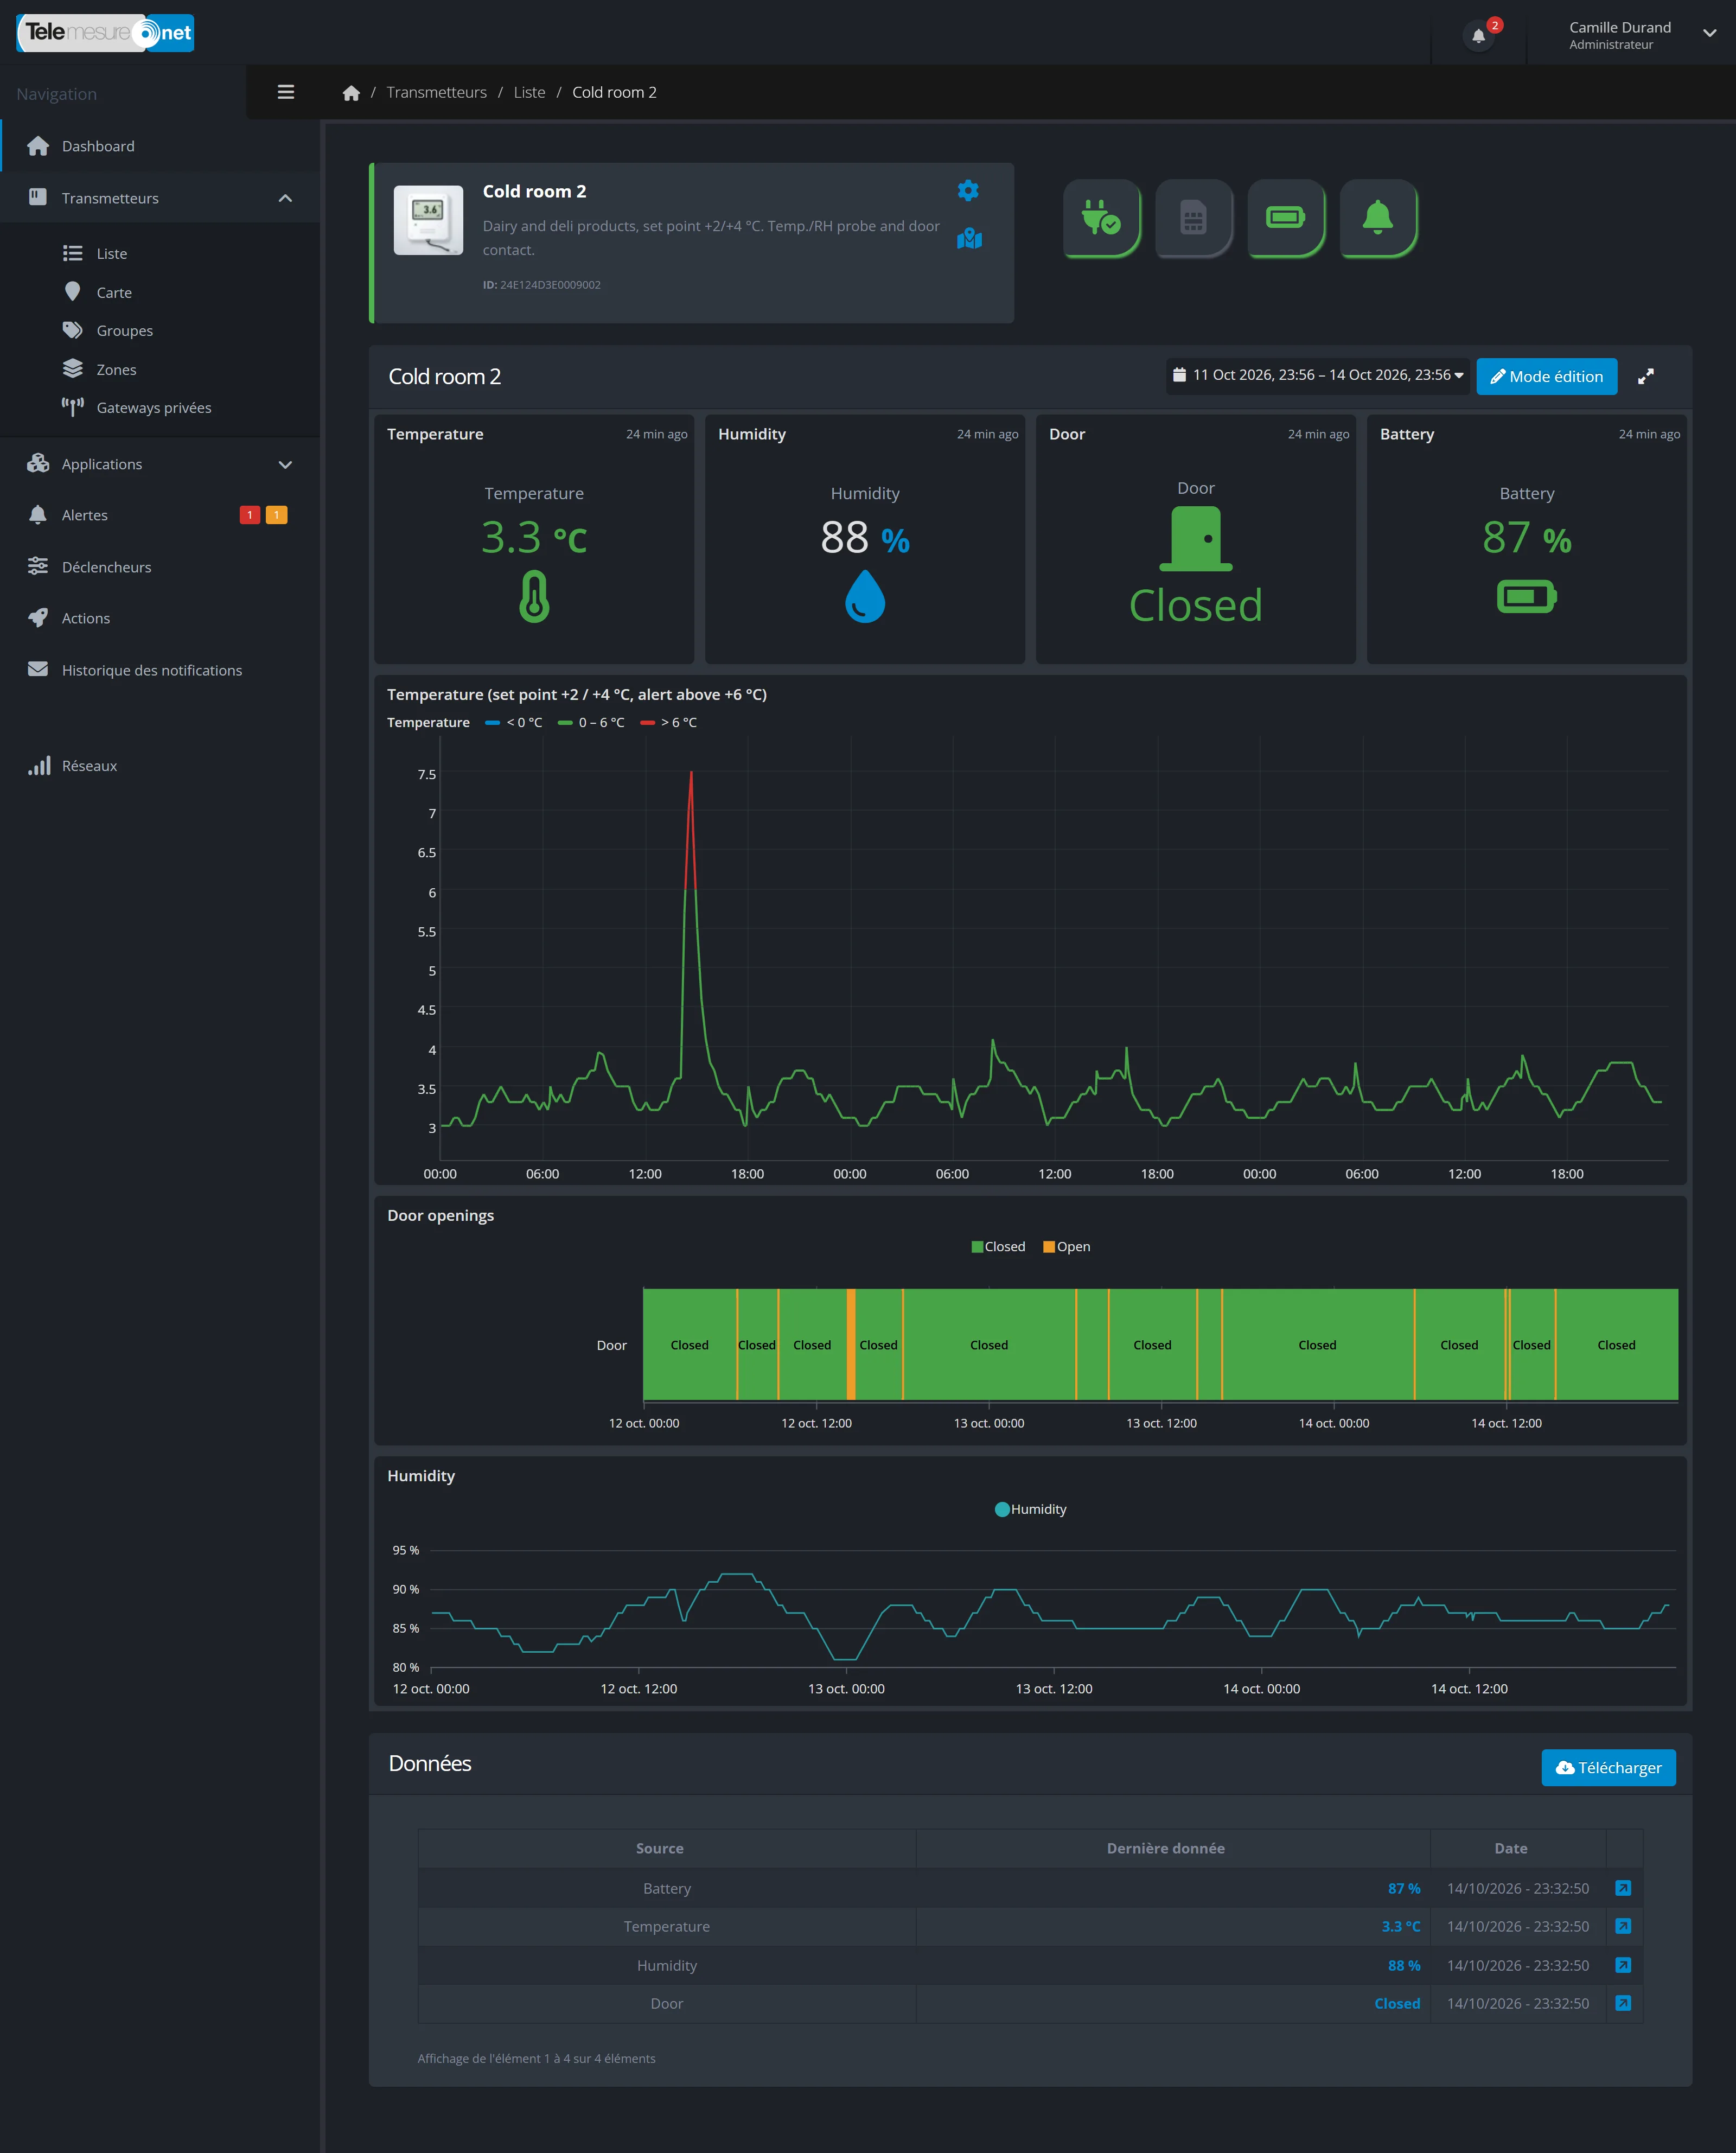
The page shows the photo, the name, the latest value of each reading with its date, the location on a map and the current alert level.

  • The battery level with a colour code (good, medium, low), for devices that report it
  • An alert rule can warn you of a low battery
  • An export of the data for a given period, sent to you by email
  • Radio signal quality, for Sigfox devices and some LoRaWAN networks
Enlarge the screenshot: The page for cold room 2, with a photo of its wall-mounted probe: latest values received for temperature (3.5 °C), humidity, door (closed) and battery, a 3-day temperature chart that turns red above the 6 °C threshold, a timeline of door openings, a humidity chart and a table of the latest data
A cold room sensor’s page: latest values received, a chart with its alert threshold and door openings (demo data)

Device map

Your devices on a map

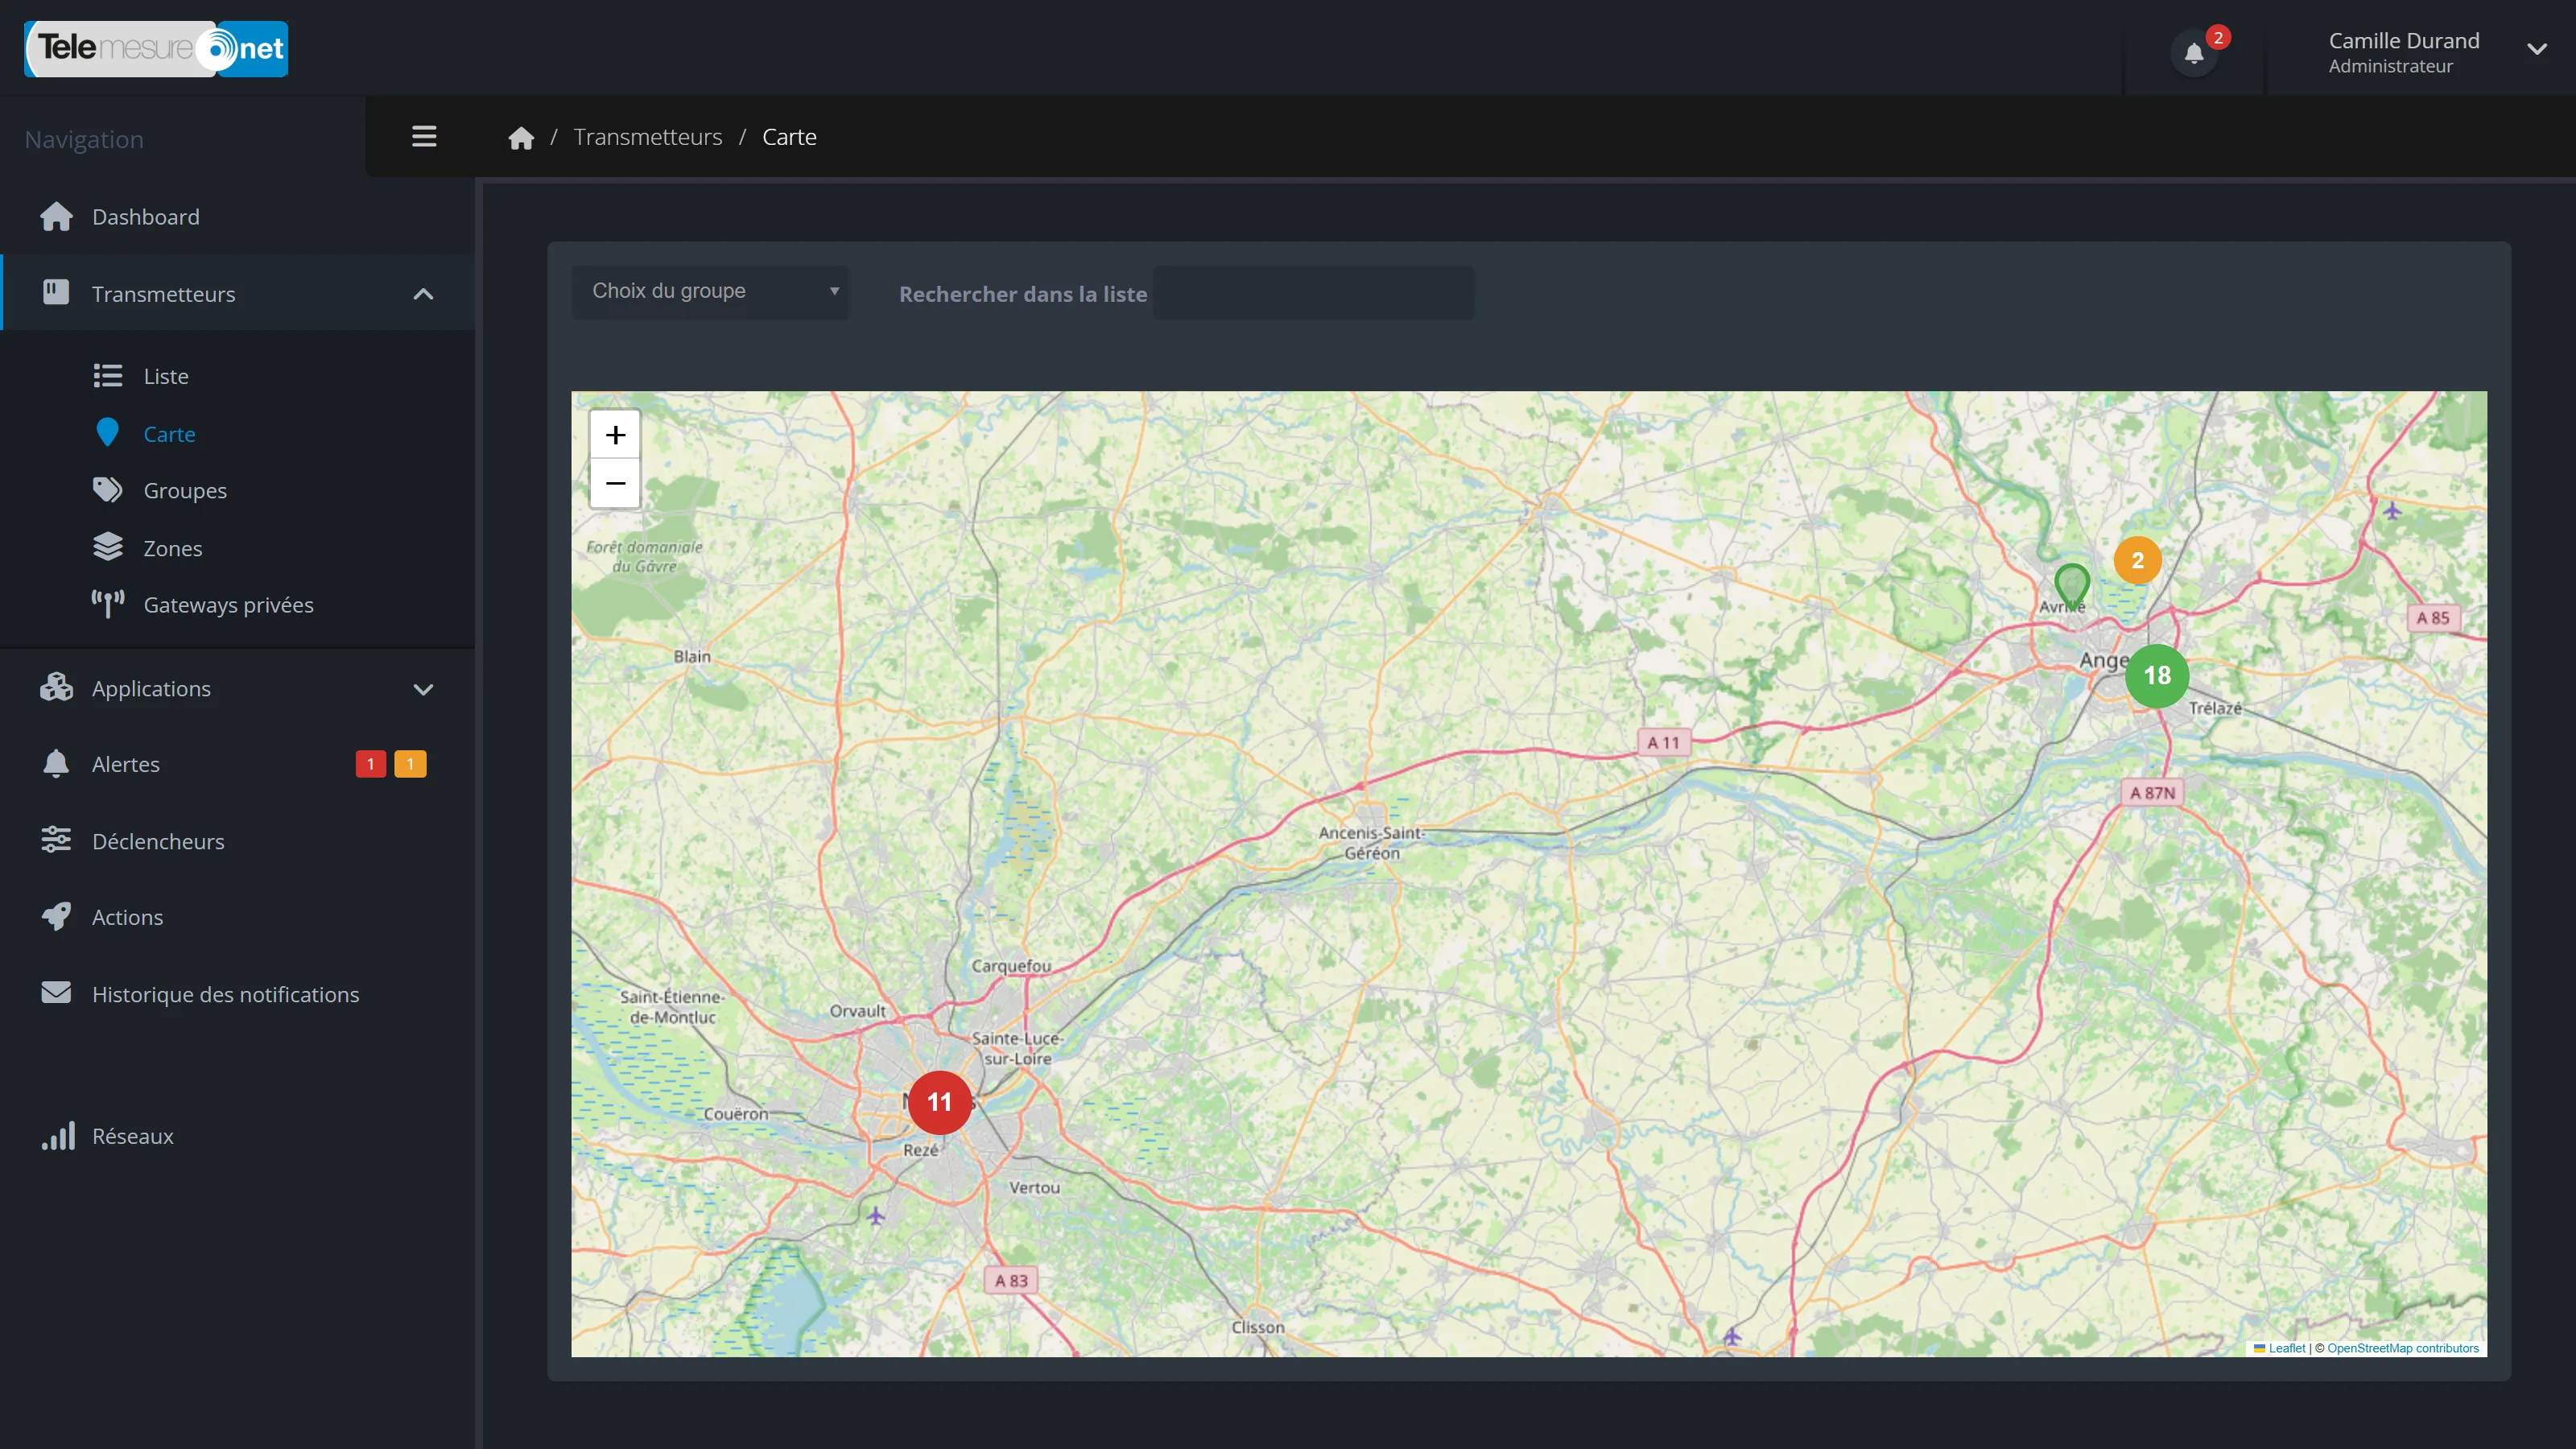
A map shows all your devices whose location is known. For a device in a fixed spot, you place its marker by searching for its address.

You can also draw zones on the map, for example a site and then a building on that site, and organise your devices within them.

Enlarge the screenshot: Map of your devices on an OpenStreetMap background, between Nantes and Angers: numbered clusters of connected devices, coloured according to the most serious alert, red in Nantes, green and orange around Angers
The device map: devices grouped together when they are close, coloured according to the most serious alert. Map background © OpenStreetMap contributors (demo data)

Dashboards

Dashboards that fit the way you work

You build your own monitoring screens: the readings that matter to you, over the period you are interested in, at your desk or on a wall screen.

Building your screens

You place blocks on a grid

You create, rename, duplicate, reorder or delete your dashboards. You choose the period displayed: last hour, today, 24 h, 7 days, 30 days, 12 months or any dates you like.

  • When you zoom in on a chart, all the blocks follow
  • Refreshed every minute, with a full-screen mode for wall displays
  • Administrators, and the users they allow, edit the dashboards, and everyone else can view them
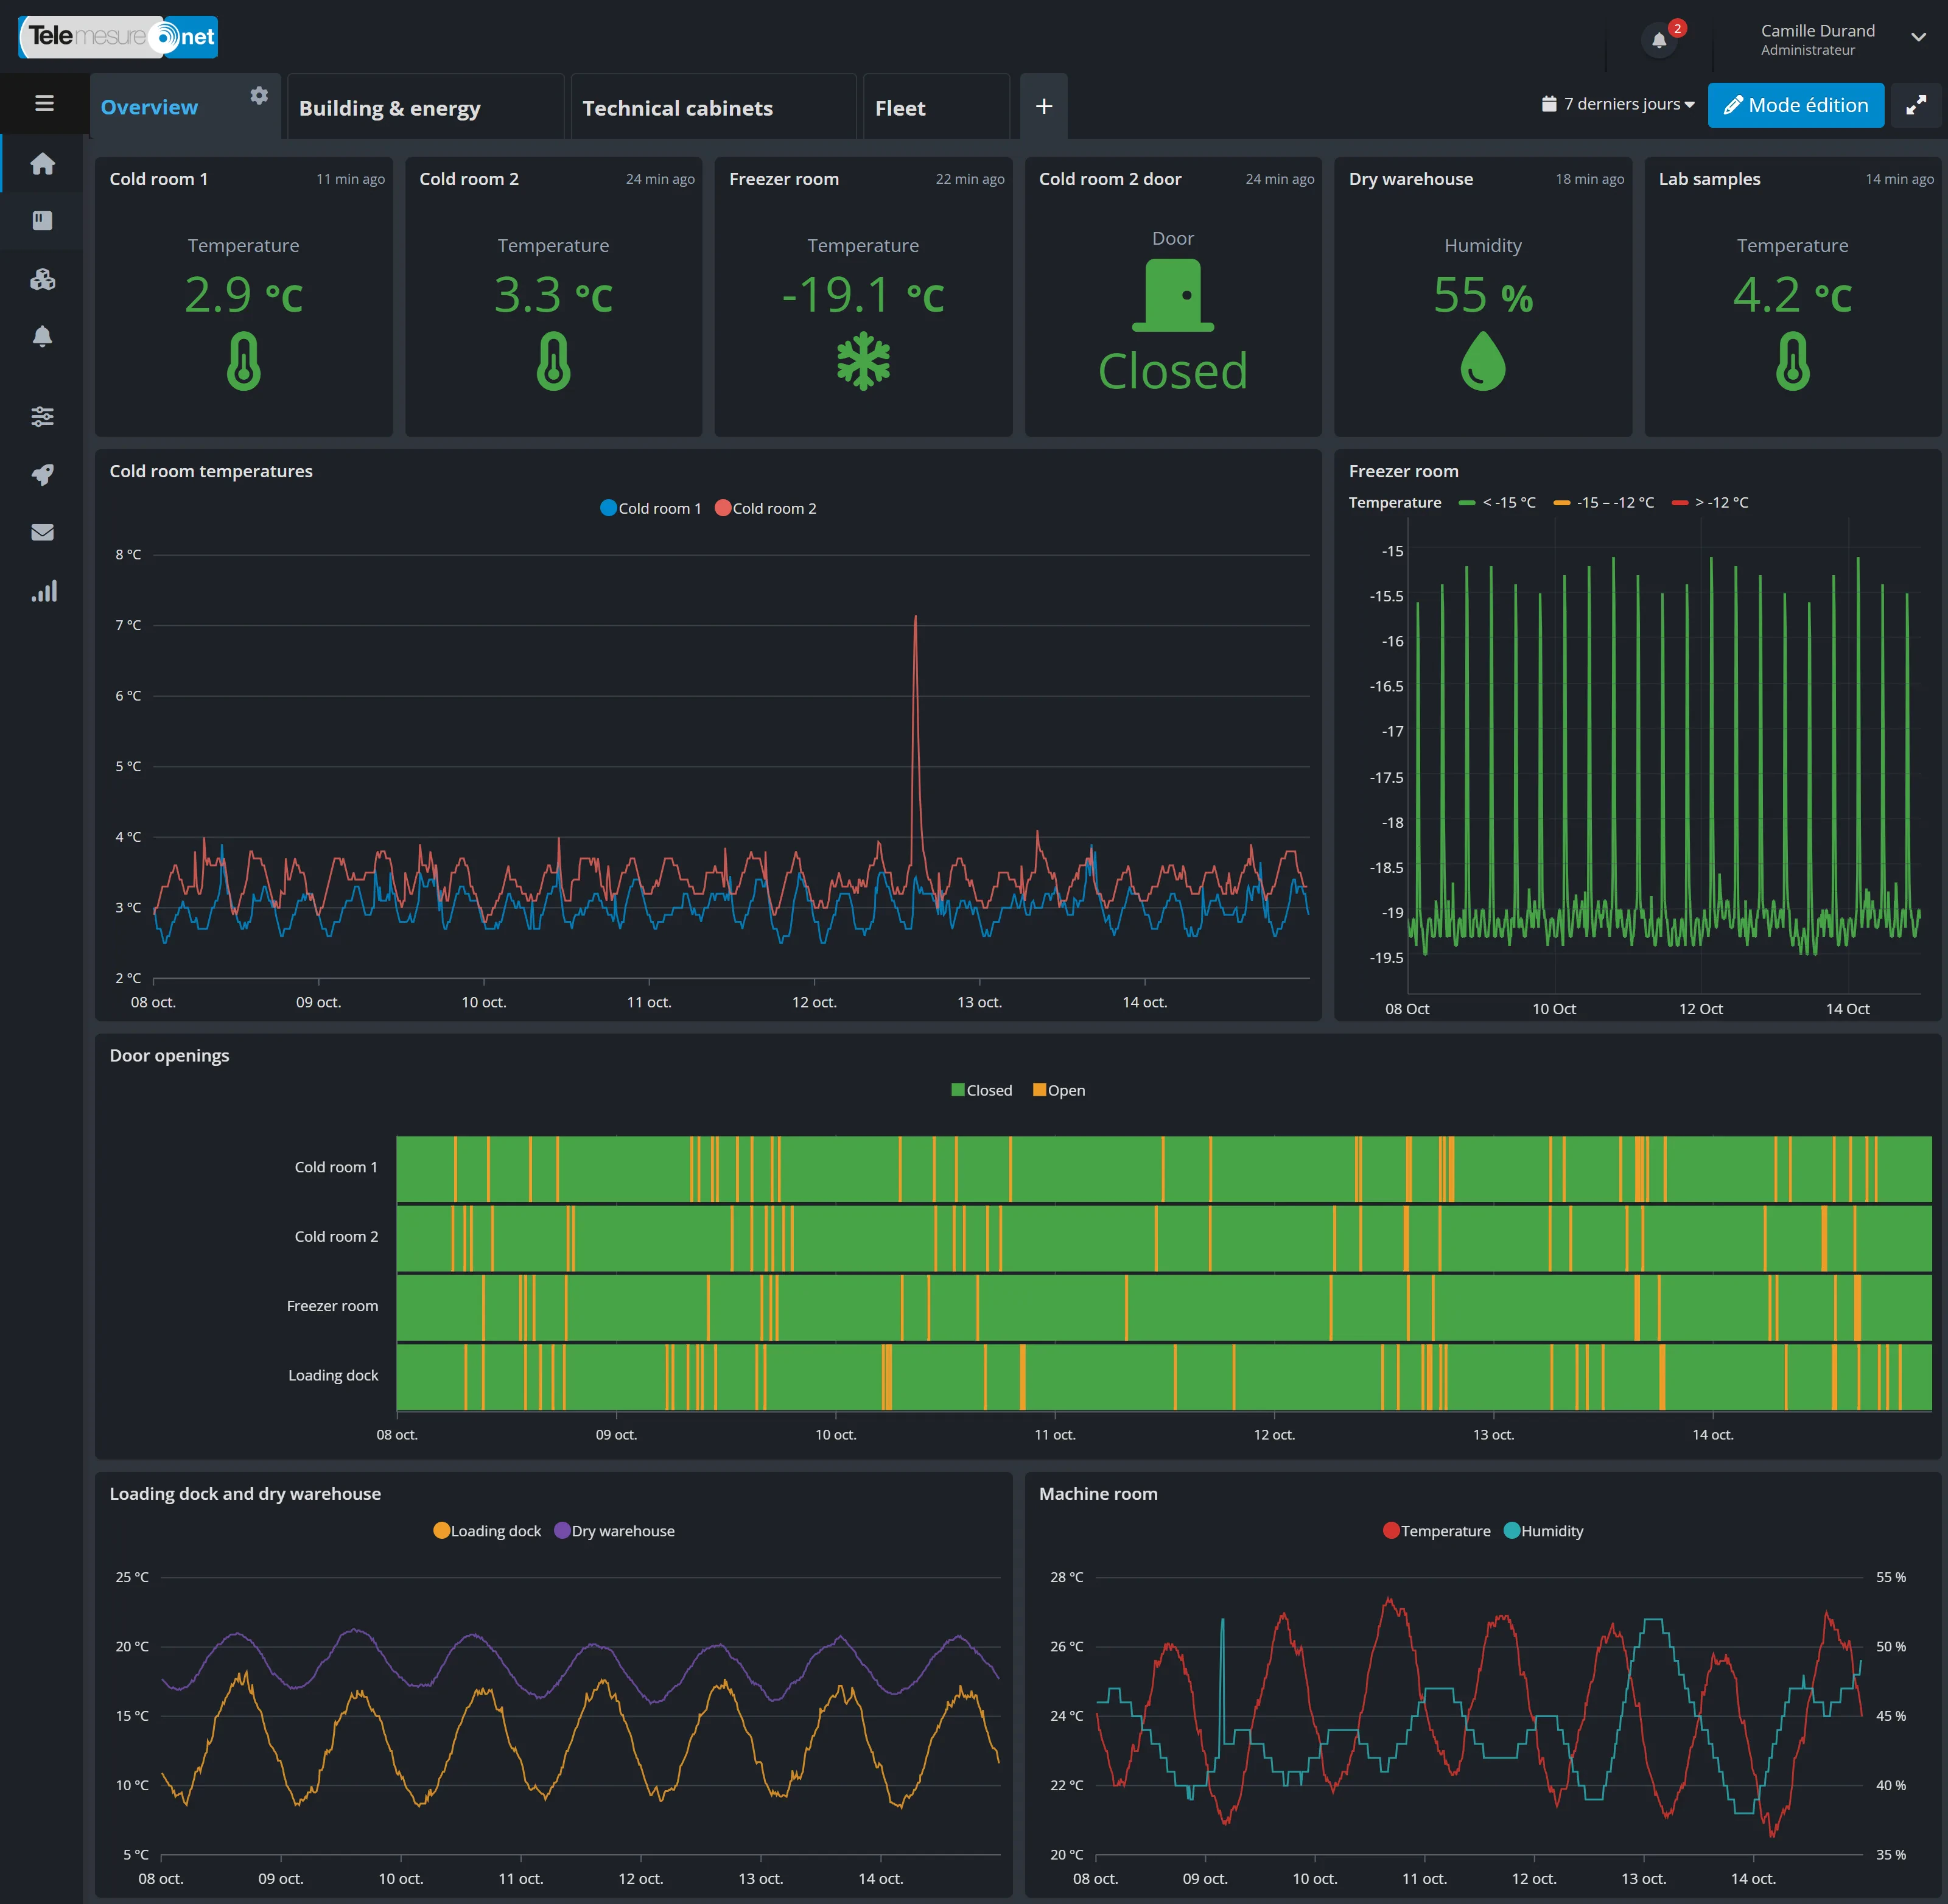
Enlarge the screenshot: The “Overview” dashboard: value cards for the cold rooms, the dry store and the sample fridge, temperature charts for the two cold rooms over 7 days, a threshold-coloured chart for the freezer room and a timeline of door openings
A dashboard made of blocks: value cards, charts, a threshold-coloured chart and a timeline of door openings (demo data)

Five types of block to read your data

Each block below is taken from a dashboard in the portal.

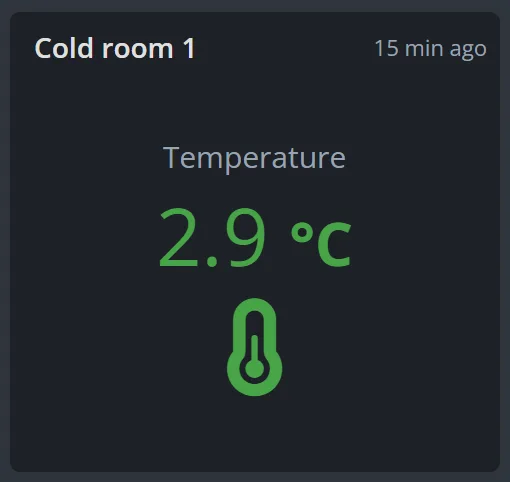
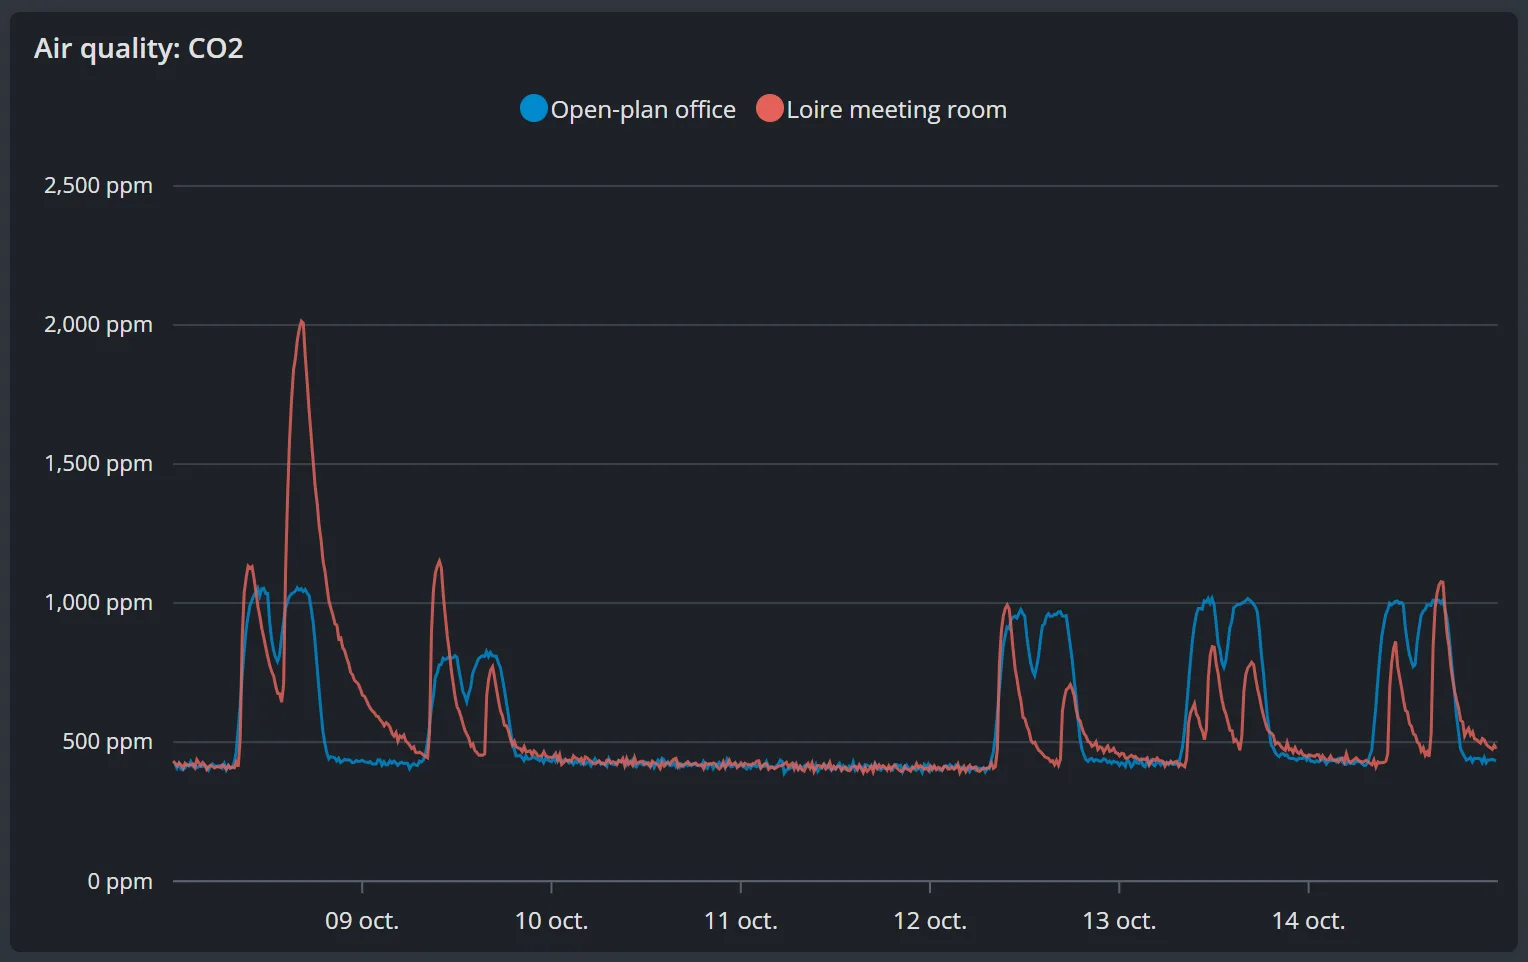
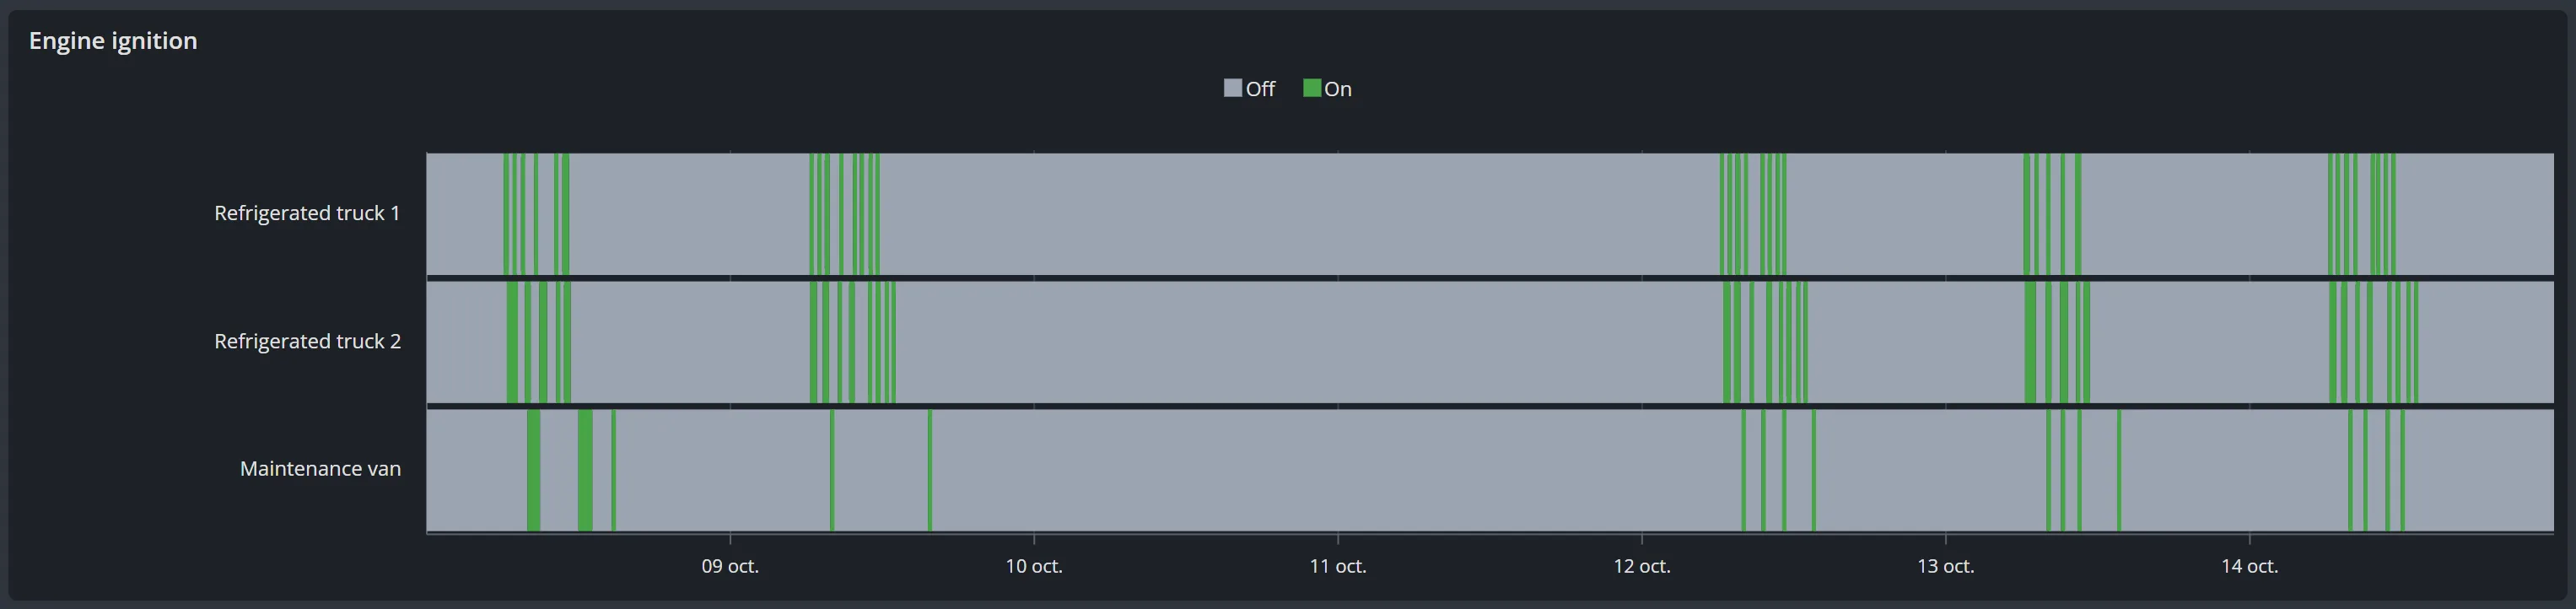
Five blocks taken from the portal’s dashboards, click to enlarge (demo data)
  • A dashboard for each device

    Each device can have its own dashboard, shown on its page. To save time, you copy the layout from a device of the same model.

  • Readings that speak your language

    For each reading, you choose its name, its unit and how it is displayed. A simple formula, tested before you confirm it, can for example convert a height into litres in a straight-sided tank. It applies to new data.

    You also set colour thresholds, which are used on value cards and charts.

Alert rules

Be alerted at the right time

You decide what deserves an alert, how serious it is, and who to notify at what time. Alerts then go out automatically, and each one is followed until things are back to normal.

Alert rules

A guided form that reads like a sentence

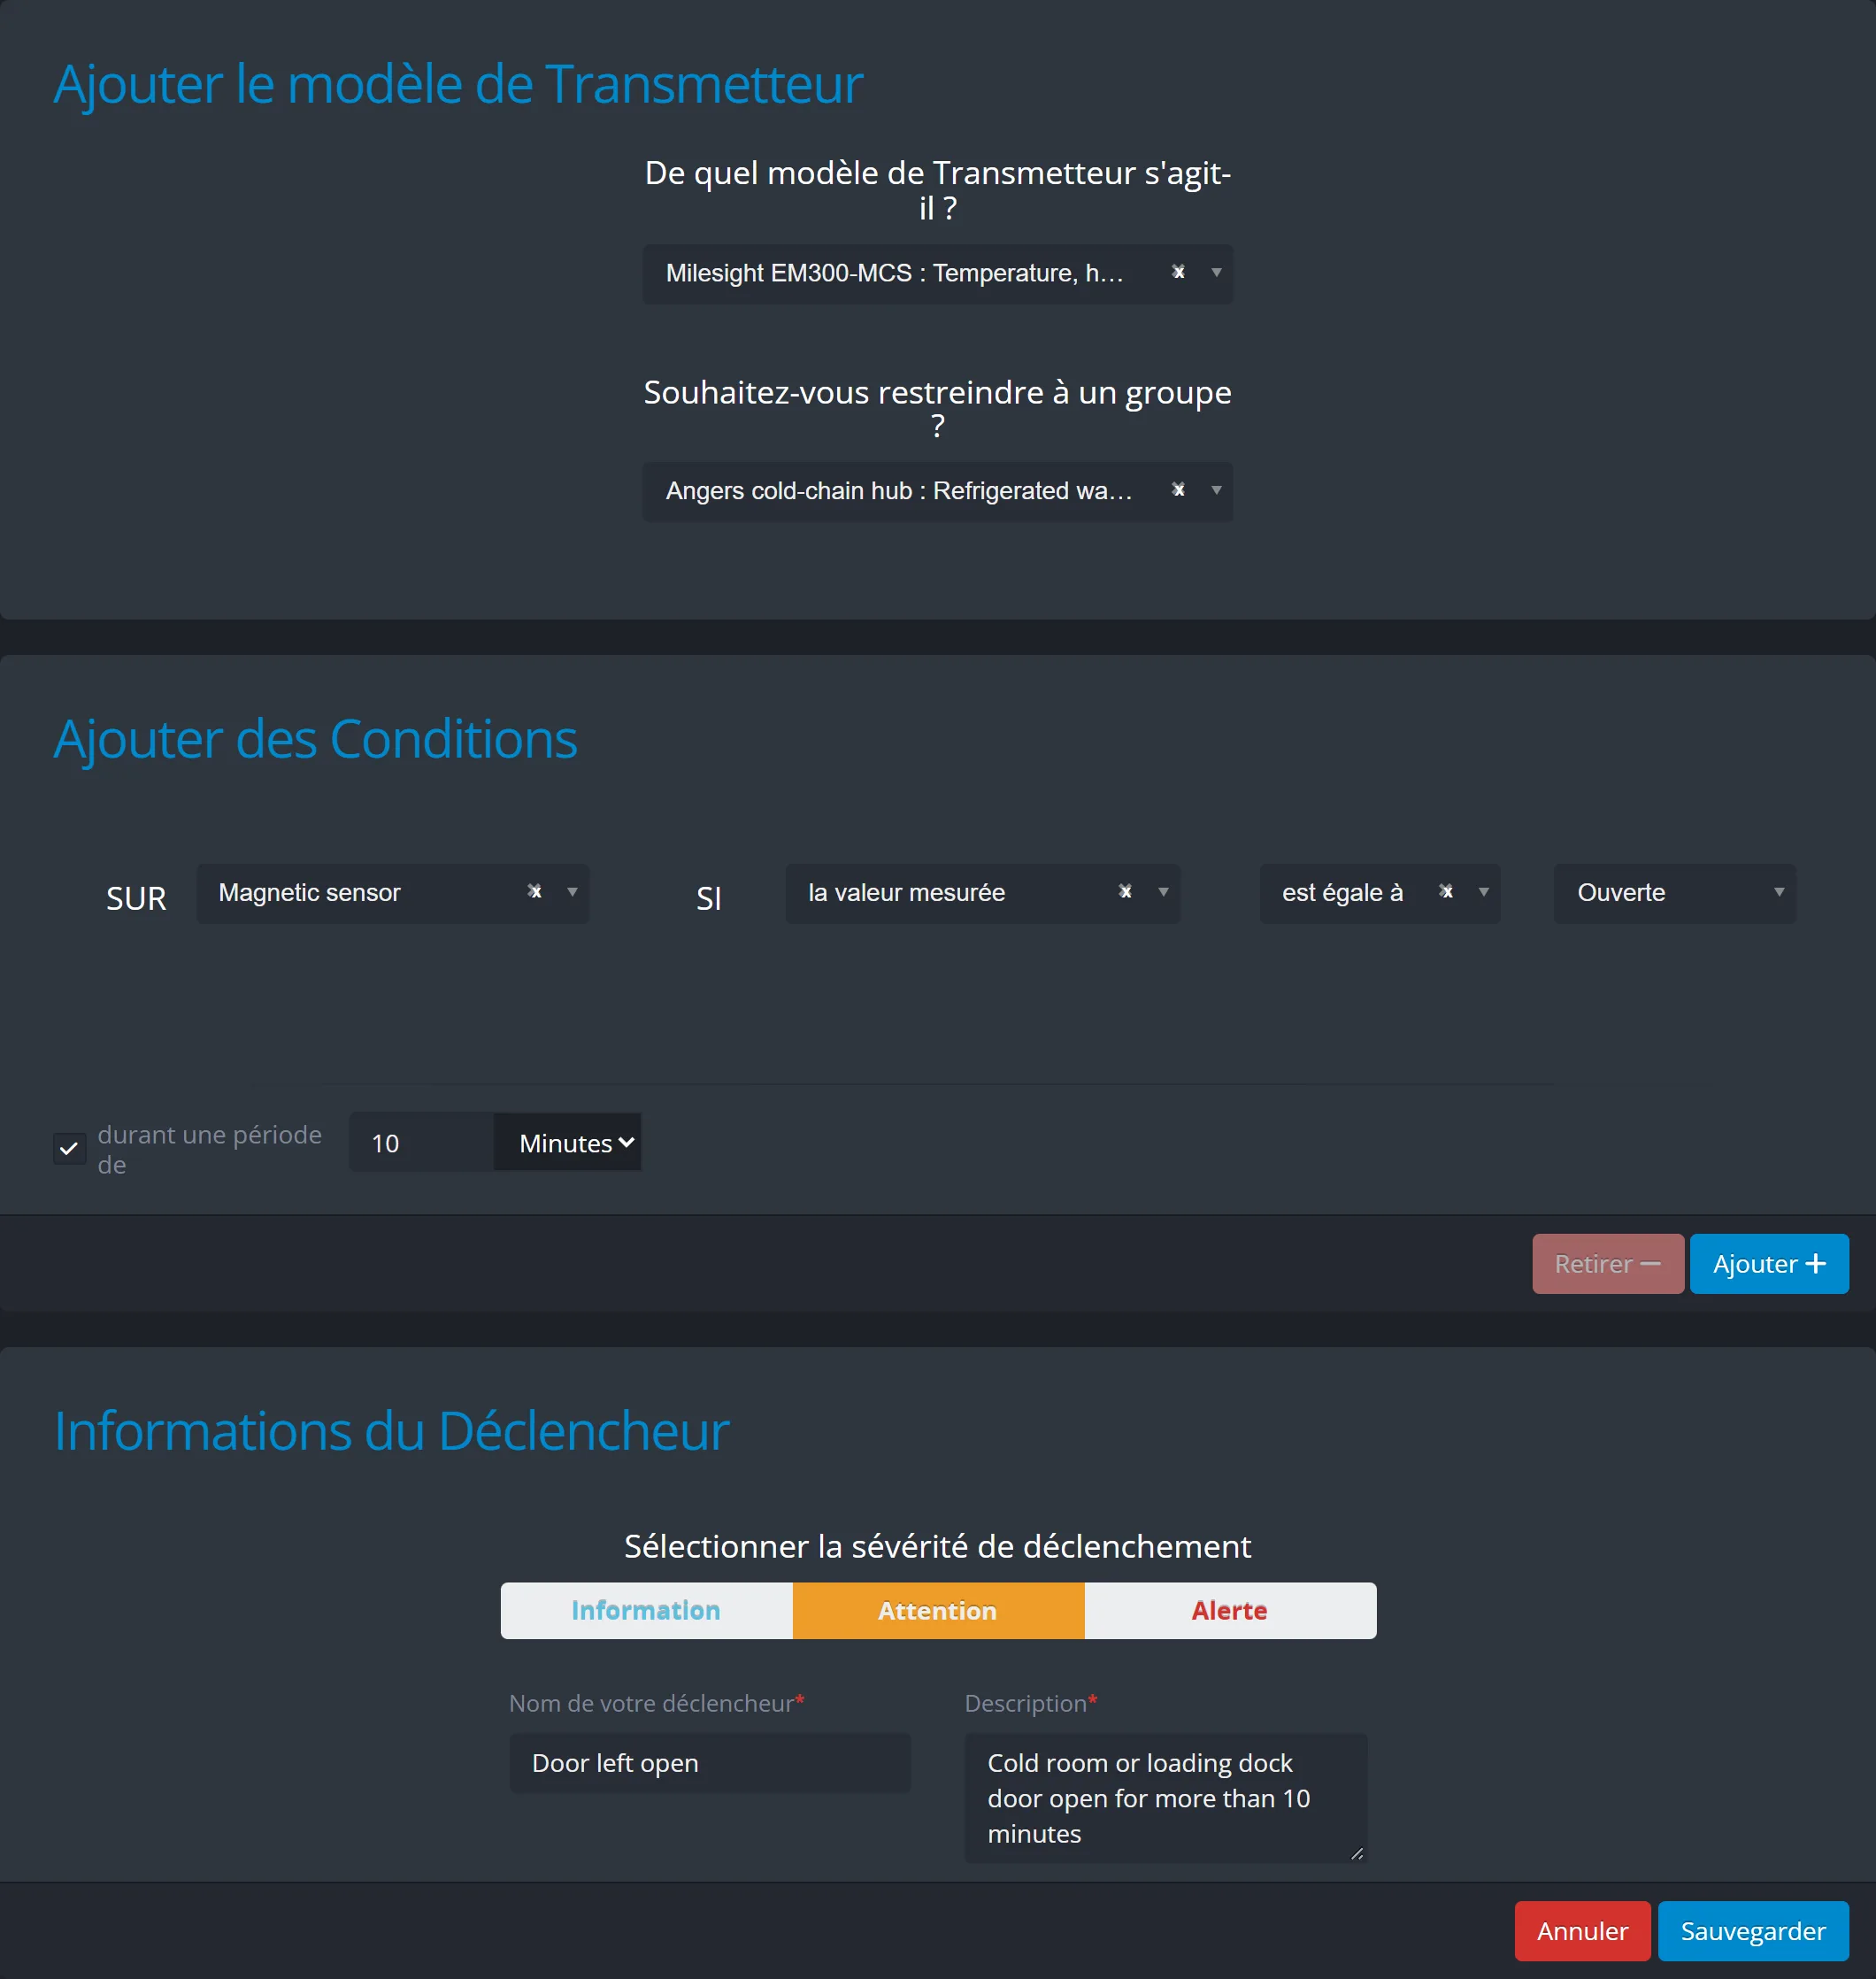
You build each rule piece by piece: “ON this device, IF the measured value is greater than…”. Each rule has a severity level and can be paused.

  • The latest value, the average of the last 2 to 10, or the difference between two values
  • A value inside a range, or outside it
  • Two conditions linked by AND or OR, and a minimum duration
  • One or two devices, or all devices of the same model, limited to a group if needed

In the portal, these rules are called “triggers”.

Enlarge the screenshot: Creating an alert rule: a temperature and humidity sensor model with a door contact, restricted to the Angers fresh-produce hub group, the condition “ON Magnetic sensor, IF the measured value is equal to Open”, lasting for 10 minutes, severity Warning, and the rule’s name and description
A rule built like a sentence: ON the door sensor, IF the door is open for 10 minutes, then Warning (demo data)

Three severity levels

An example of settings for each level:

  • Information

    To keep a record

    A useful event to know about, with no urgency: an email to the person in charge is enough.

  • Warning

    Keep an eye on it

    A value that is drifting: a text message (SMS) or a push notification alerts the team during the day.

  • Alert

    Deal with it right away

    The on-call person is called. If nobody acknowledges the alert, the next person is called in turn.

  • A device gone quiet? For each device, you can be alerted if it stops reporting, after a delay you choose between 4 hours and a week, with the severity level of your choice.

  • No repeated alerts. A rule can require the condition to last for a certain time before it triggers. For particular needs, our team can also set up alerts that start at one threshold and only stop at another.

Rule list

All your rules on a single page

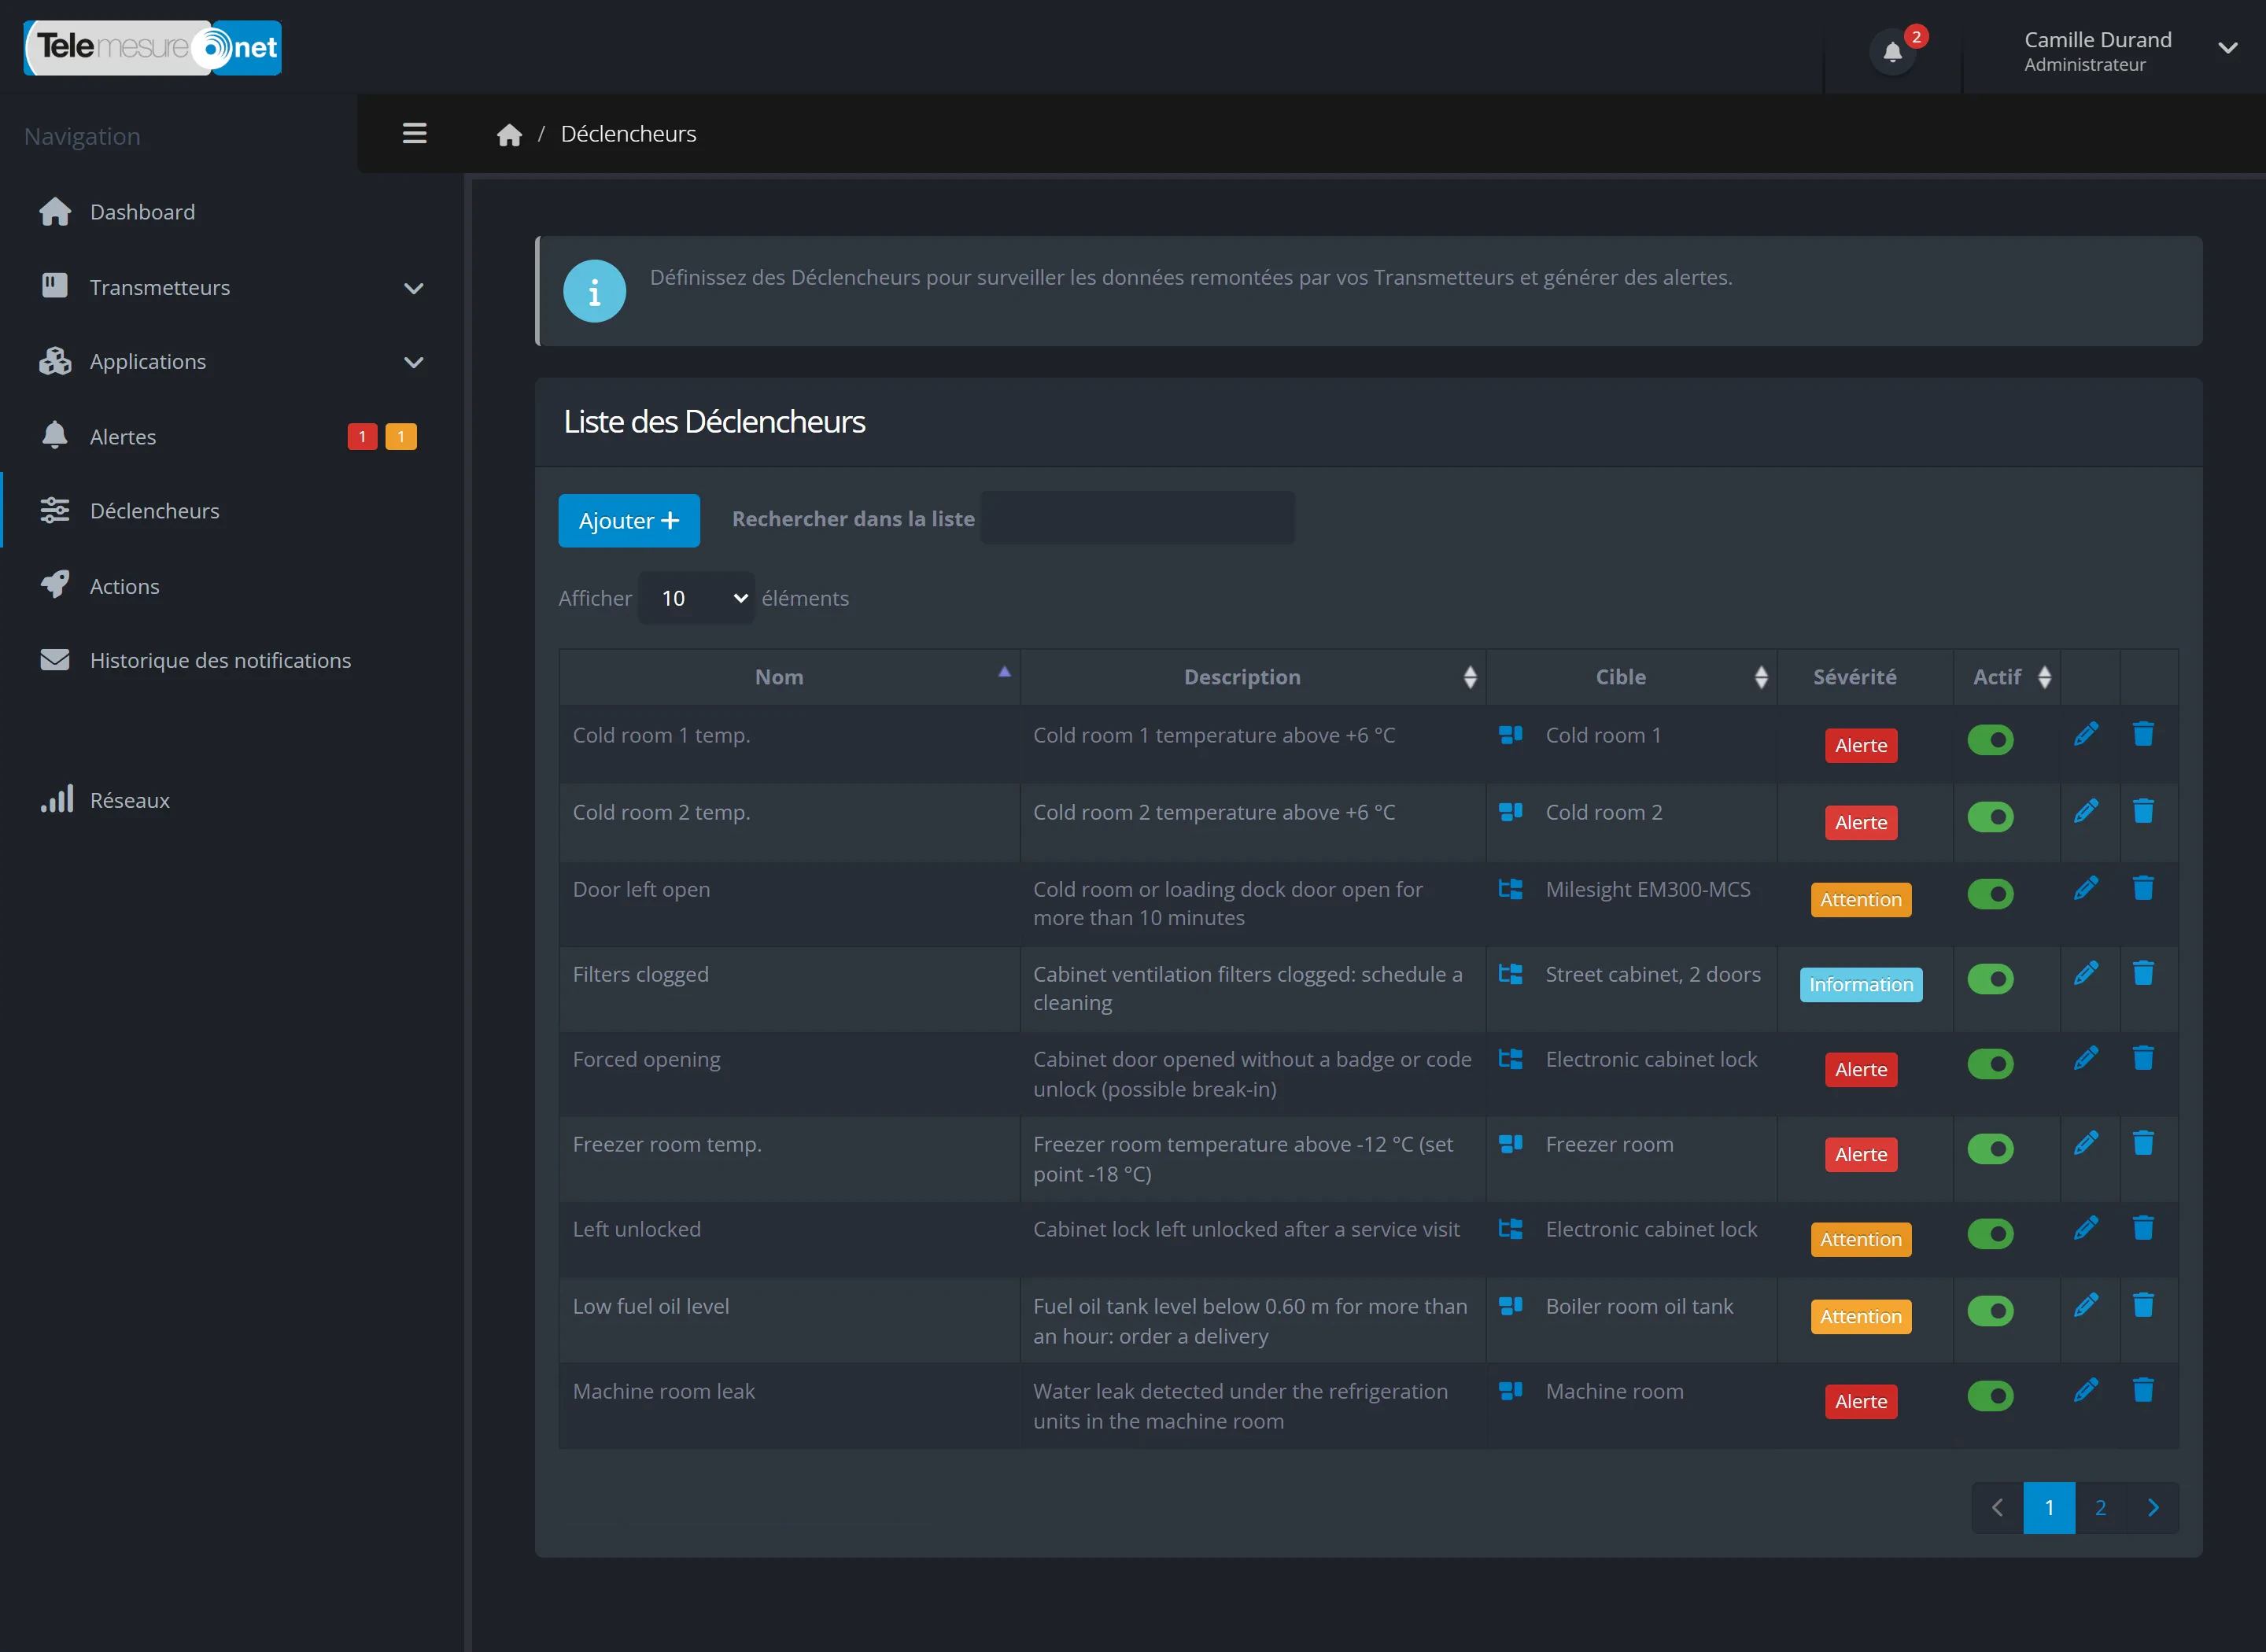
Each rule shows its description, its target (a specific device or all devices of the same model) and its severity level. A switch pauses or reactivates it, without deleting it.

Enlarge the screenshot: The portal’s trigger list: for each rule, its name, description, target (a specific device or a whole device model), severity (Information, Warning or Alert) and an on/off switch
Alert rules on one page: their target, a single device or a whole model, their severity and a switch to pause them (demo data)

On-call

Who to notify, how and when

The right people are alerted, and everyone else is left undisturbed.

  • Emaila written record of every alert

  • Text message (SMS)on any phone

  • Voice callpress 1 to acknowledge

  • Push notificationin the Telemesure app

Your on-call rota, hour by hour

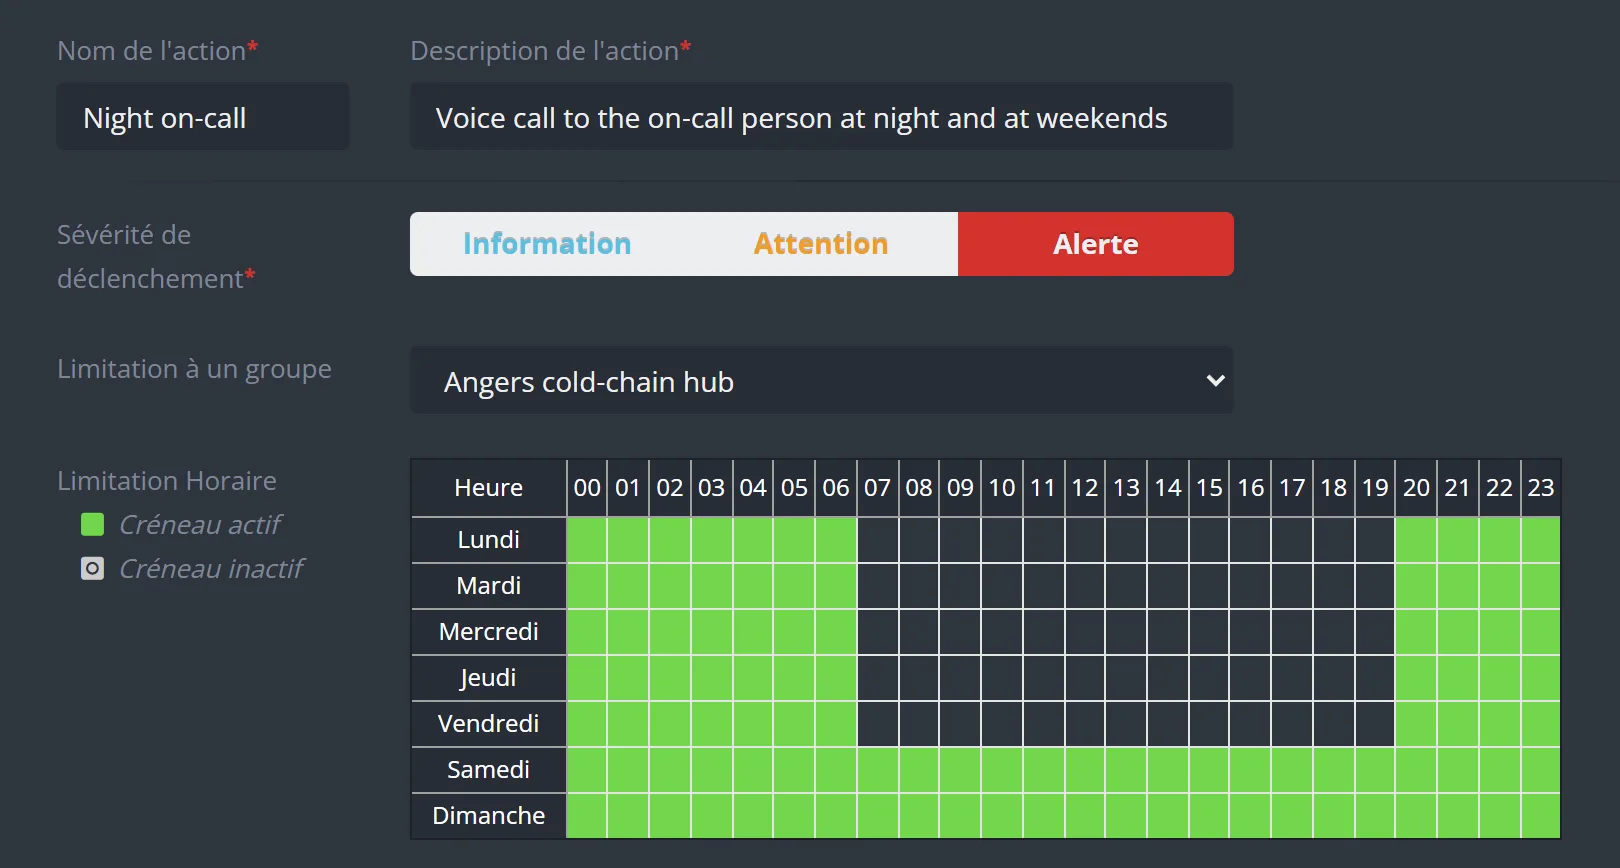
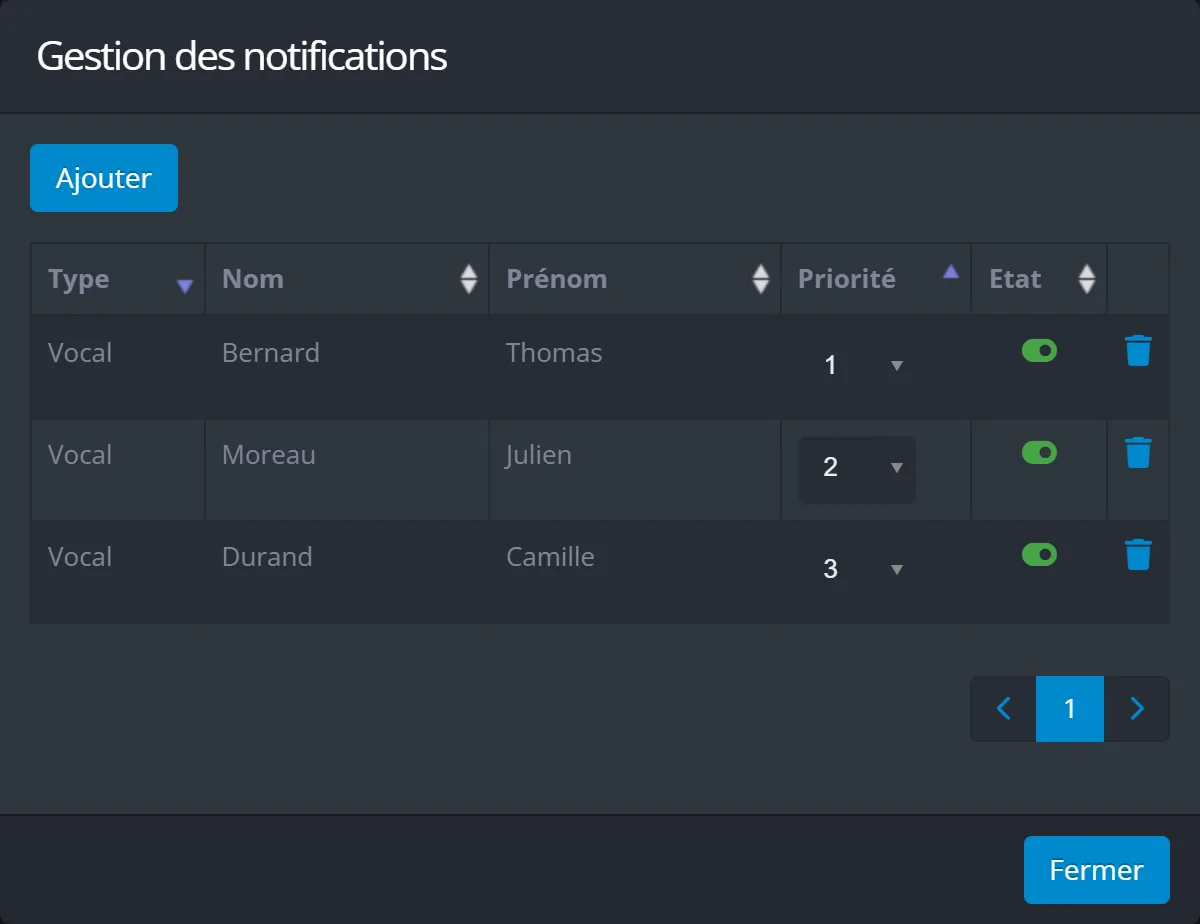
You set an order of priority between people. Each notification can be limited to a group of devices and to time slots, on a weekly grid, hour by hour.

  • For each severity level: the people and how to reach them
  • An order of priority between people
  • Time slots on a weekly grid, hour by hour
  • Notifications limited to a group of devices, if needed

Every notification sent is recorded in the notification history. In the portal, these notification settings are called “actions”.

Enlarge the screenshot: Editing the “Night on-call” action in the portal: a voice call to the on-call staff at night and at weekends, severity Alert, limited to the Angers fresh-produce hub site, and the weekly grid hour by hour, active from 20:00 to 7:00 Monday to Friday and all day on Saturday and Sunday Enlarge the screenshot: The “Notification management” window for the on-call action: three voice calls in order of priority, 1 Thomas Bernard, 2 Julien Moreau, 3 Camille Durand, each one enabled
An on-call action: the Alert level, the site concerned, the weekly time slots and the order in which people are called (demo data)

Voice calls, one after another

Only voice calls are chained: emails, text messages and push notifications go out straight away.

  1. A voice reads out the alert

    The phone of the first person on the list rings, and a voice reads the alert to them.

  2. Press 1 or press 0

    They press 1 to acknowledge the alert, or 0 to hear it again.

  3. If not, the next person

    If nobody acknowledges the alert, the system calls the next person, in the order you have set.

  4. The calls stop

    The moment someone acknowledges the alert, or once the situation is back to normal.

Alert follow-up

Every alert followed until things are back to normal

Acknowledgement

Who is dealing with it, since when, and what has been done

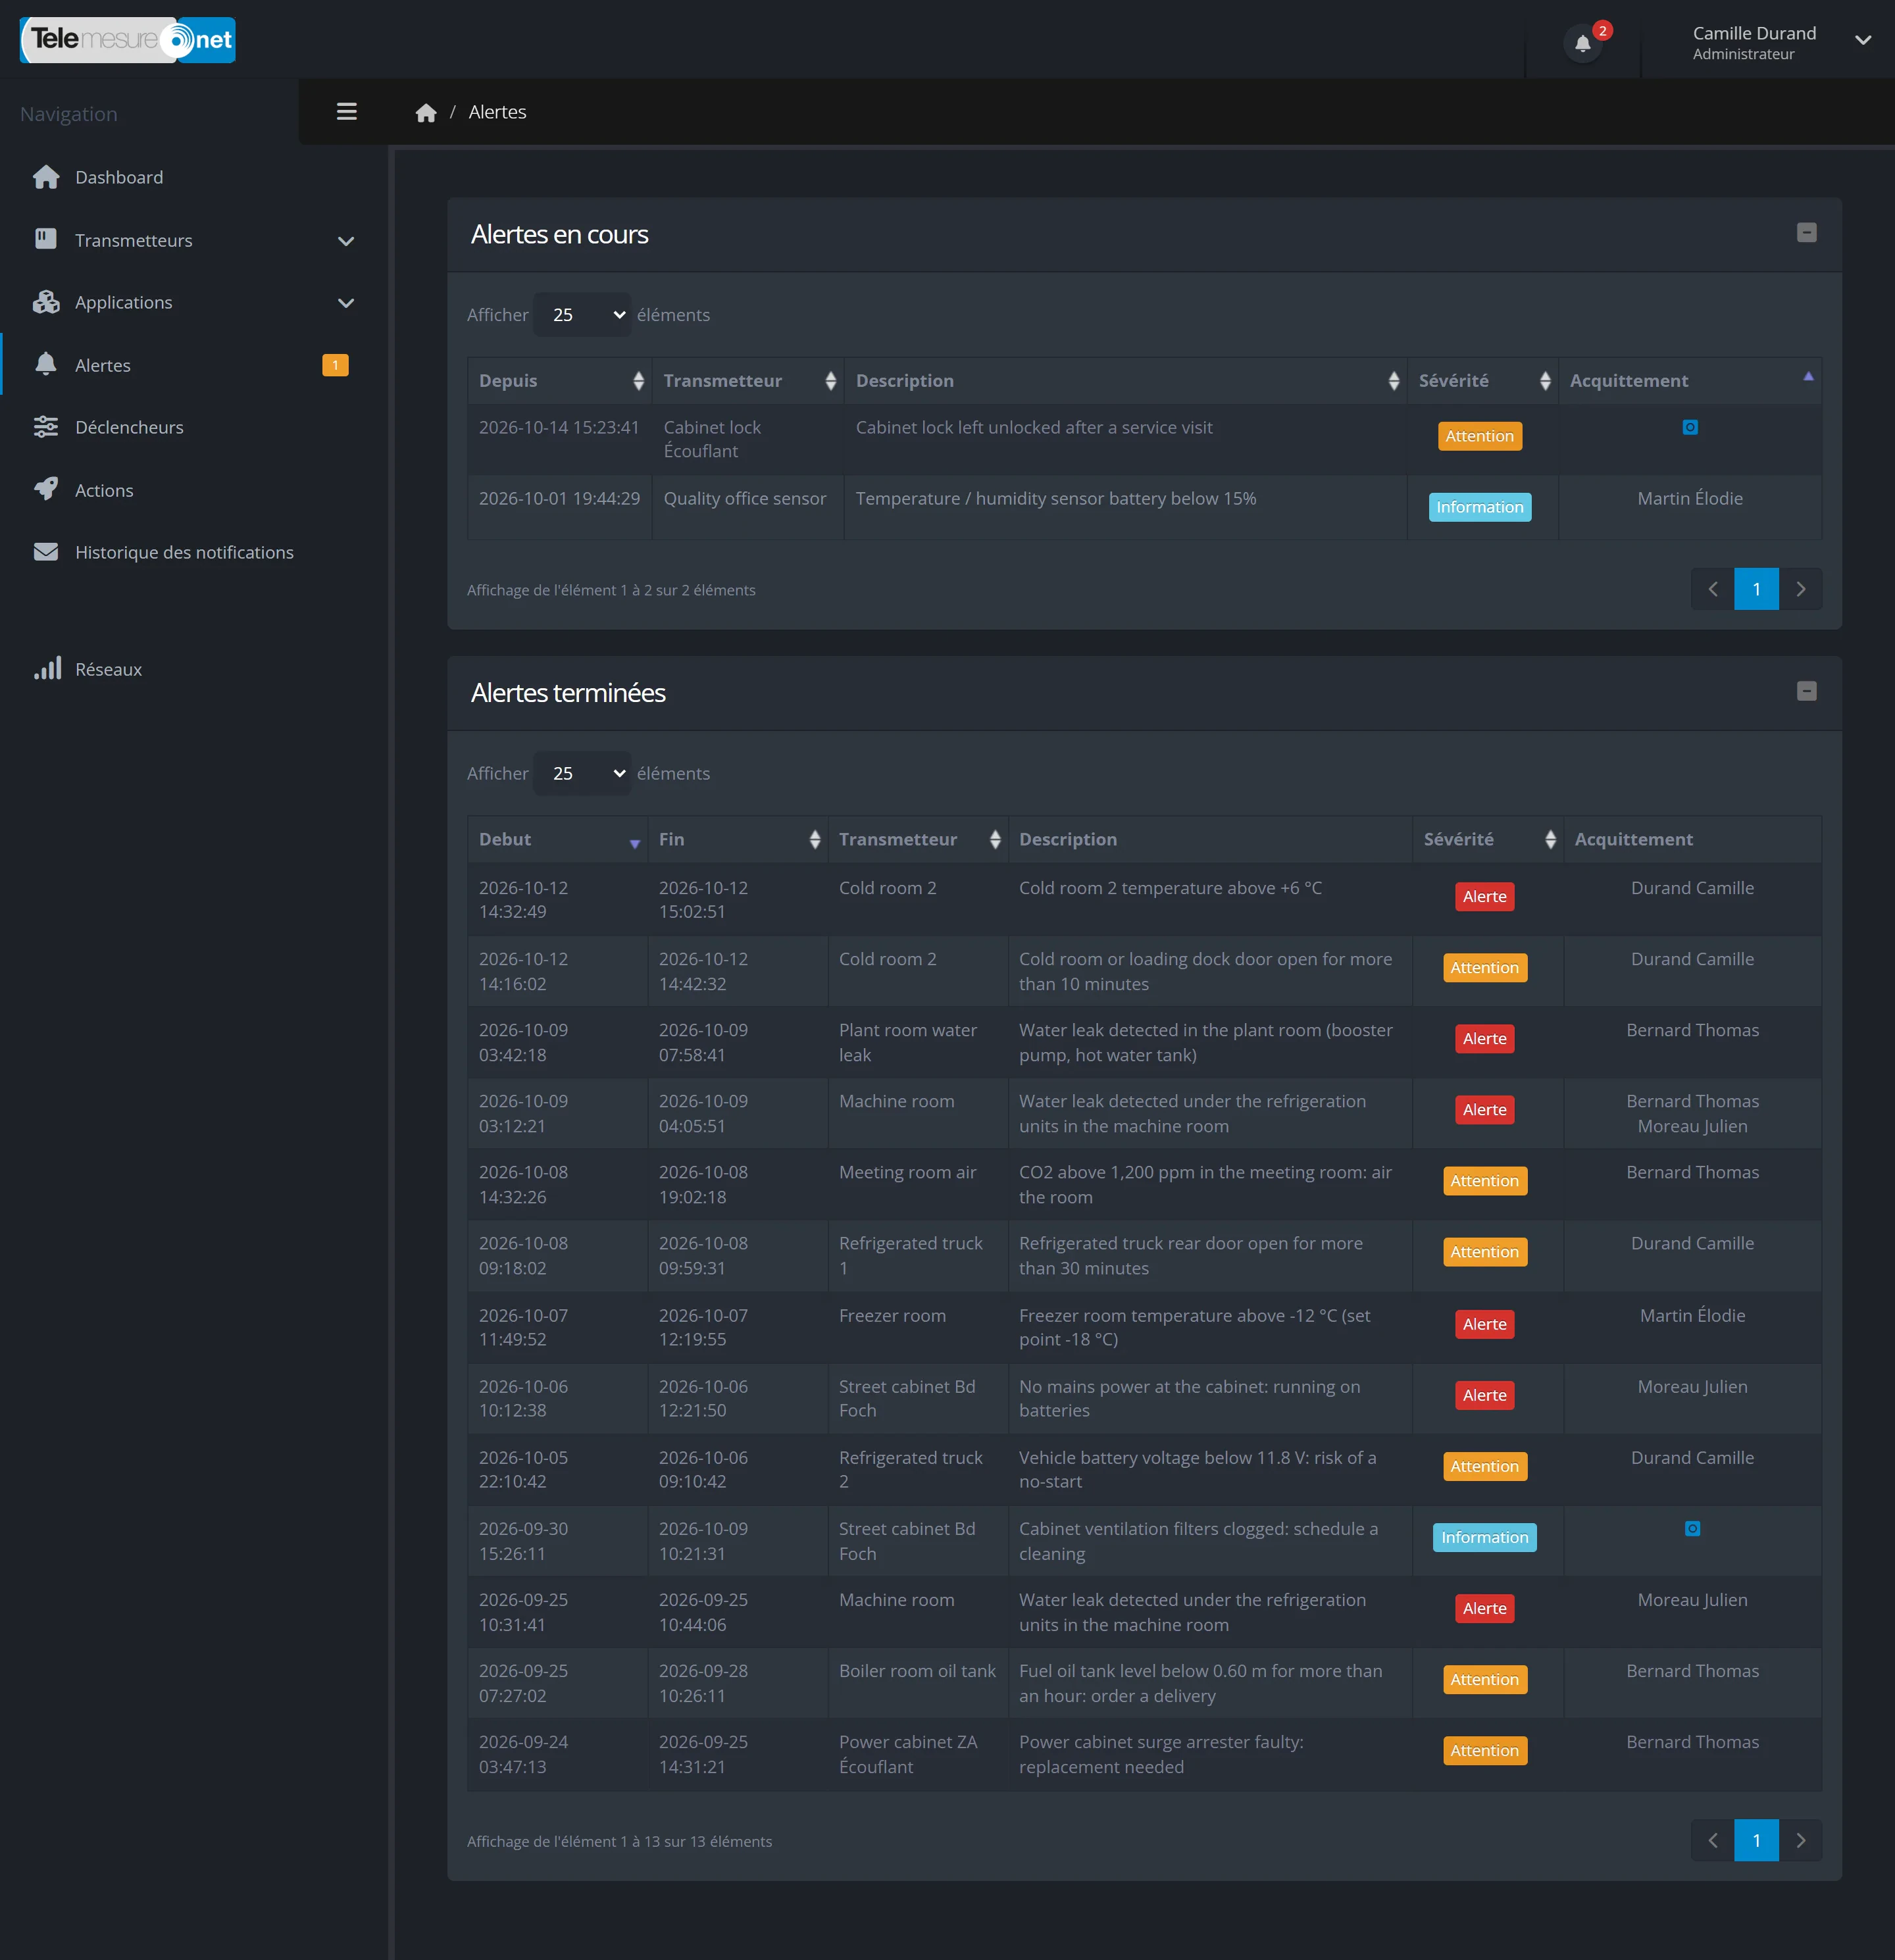
One page lists the ongoing alerts (since when, on which device, with what message and what severity) and the history of closed alerts.

To acknowledge an alert, you leave a message: your name and the time are recorded. An alert closes by itself when the situation returns to normal.

  • Acknowledge from the portal
  • From the mobile app
  • Or by pressing 1 during the voice call
Enlarge the screenshot: The portal’s alerts page: two ongoing alerts (Warning and Information), then the history of closed alerts with the start, the end, the device concerned, the description, the severity and the person who acknowledged the alert
Ongoing alerts and the history of closed alerts: start, end, severity and acknowledgement (demo data)

Notification history

Who was notified, and when

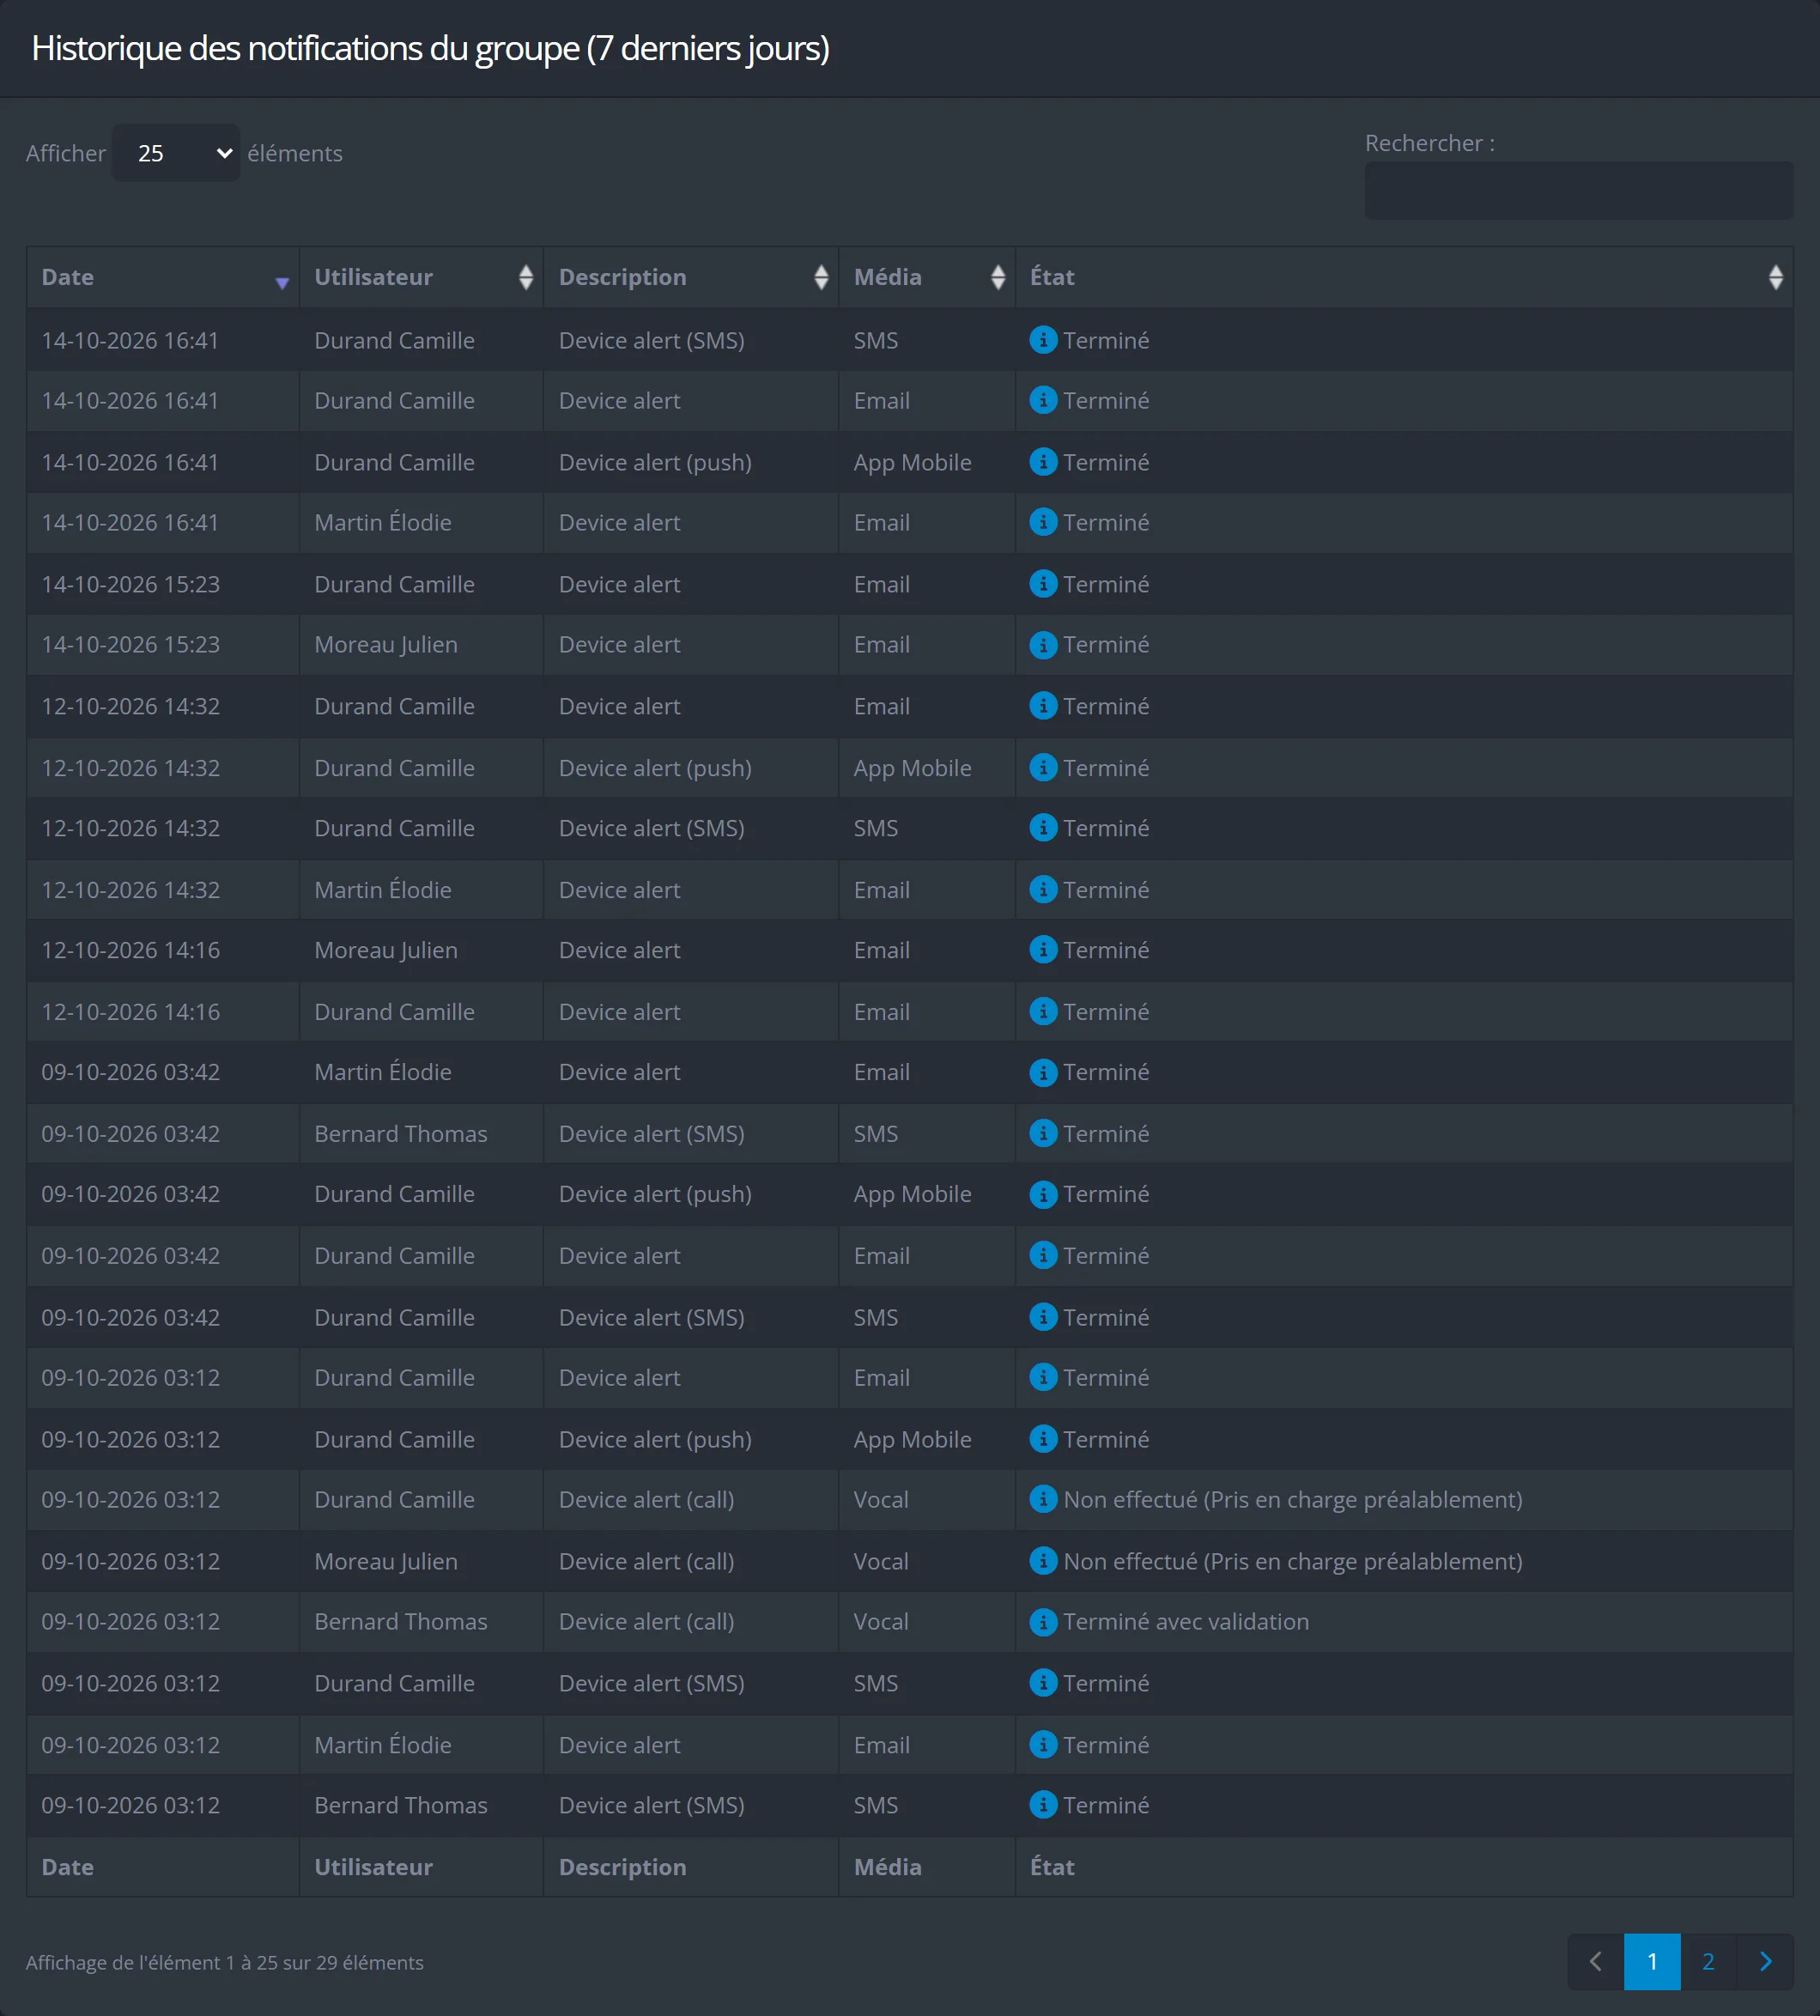
Everyone can find the alert messages they have received over the last 7 days: date, recipient, sending method and status. The administrator sees those for the whole company.

Enlarge the screenshot: The group’s notification history over 7 days: the date, recipient, message type, sending method (email, text message, voice call, mobile app) and status of each notification
The history of alert messages: who was notified, when and how (demo data)

Follow an alert step by step

Remote control

Control some of your devices without going on site

Depending on the model and the network, Telemesure sends commands and settings to your connected devices. Not every device can be controlled remotely: ask us what is possible with yours.

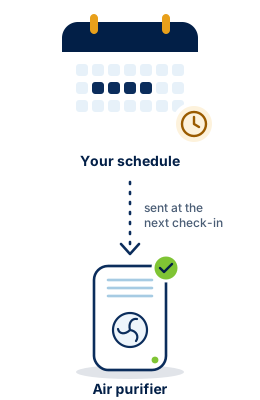
Diagram: your operating programme is sent to an air purifier, which receives it the next time it connects.
An operating programme sent remotely to an air purifier
  • Commands and settingsChange how often a device sends its data, programme an air purifier, switch equipment on or off. The command goes out the next time the device connects.

  • Dedicated settings screensFor some models, the device page has its own settings screen. On a connected button, for example, you choose what Telemesure does each time it is pressed: call, or send a text message, an email or a push notification to the person you choose.

  • Device software updatesFor devices designed for it, a manufacturer uploads new versions and chooses which devices to update, and each device fetches its update the next time it checks in. We set this up with you.

Your data

Your data, wherever you need it

Your readings don’t stay locked in the portal: you export them, receive them as reports, or send them automatically to your software.

  • Spreadsheet export

    You choose a device and a period, or several devices in a single export. The CSV file is prepared in the background, and a download link arrives by email.

  • PDF reports by email

    You choose a report template, the recipients, the frequency, the days and the time, or you run the report straight away. The templates are prepared by our team.

  • Automatic sending to your software

    Each device can send its readings, already converted into readable values, to your software’s web address (BMS, CMMS, ERP…), with the authentication your software requires. Only the readings are sent, not the alerts.

  • An API for your developers

    The administrator creates access keys for your IT teams. With them, your teams read the device list, the readings and the latest values, and submit commands to be sent to the devices. Interactive documentation is built into the portal.

  • API: an entry point that lets software talk directly to Telemesure. BMS, CMMS, ERP: your building management, maintenance management or business management software.

  • Your data belongs to you. You can export it at any time in CSV format. Your data and security

Mobile app

The essentials in your pocket, on Android and iPhone

The app brings the essentials of the portal out into the field: you receive notifications, acknowledge alerts and check your devices without a computer.

  • A home screen showing the status of your devices and alerts in charts
  • Ongoing and closed alerts, with acknowledgement and an intervention message
  • The device list, with search and favourites
  • Each device’s page: latest values, signal, map, and a photo taken on site
  • Alert notifications straight to your phone, and a dark mode
  • Adding a device with its 8-character activation code

History charts and custom dashboards stay on the web portal.

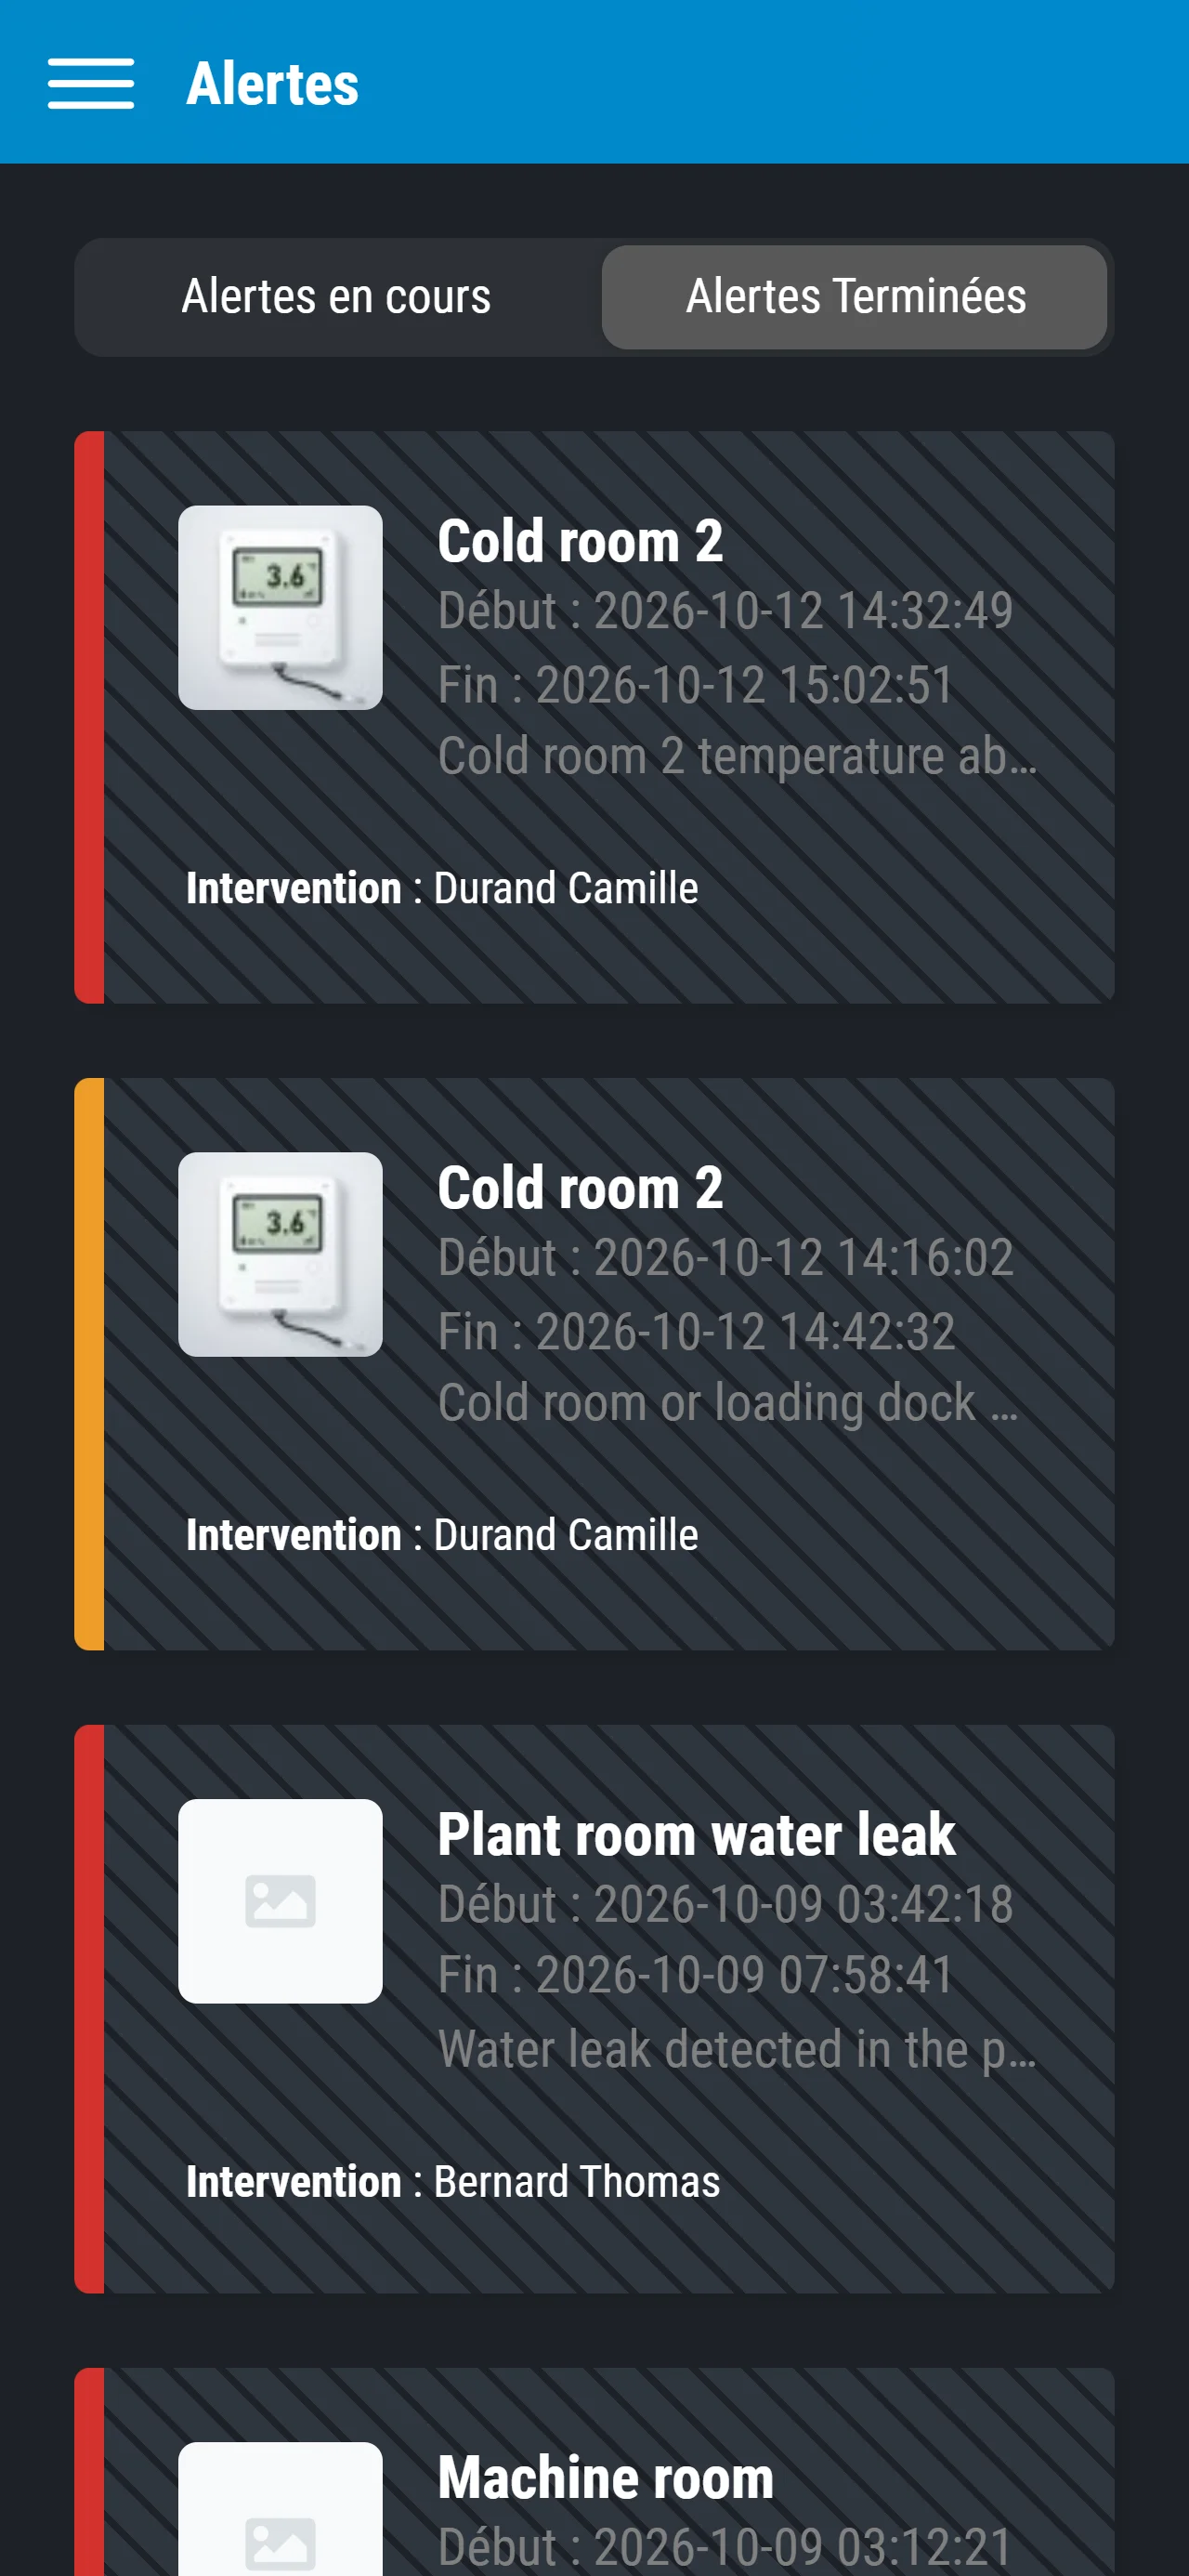
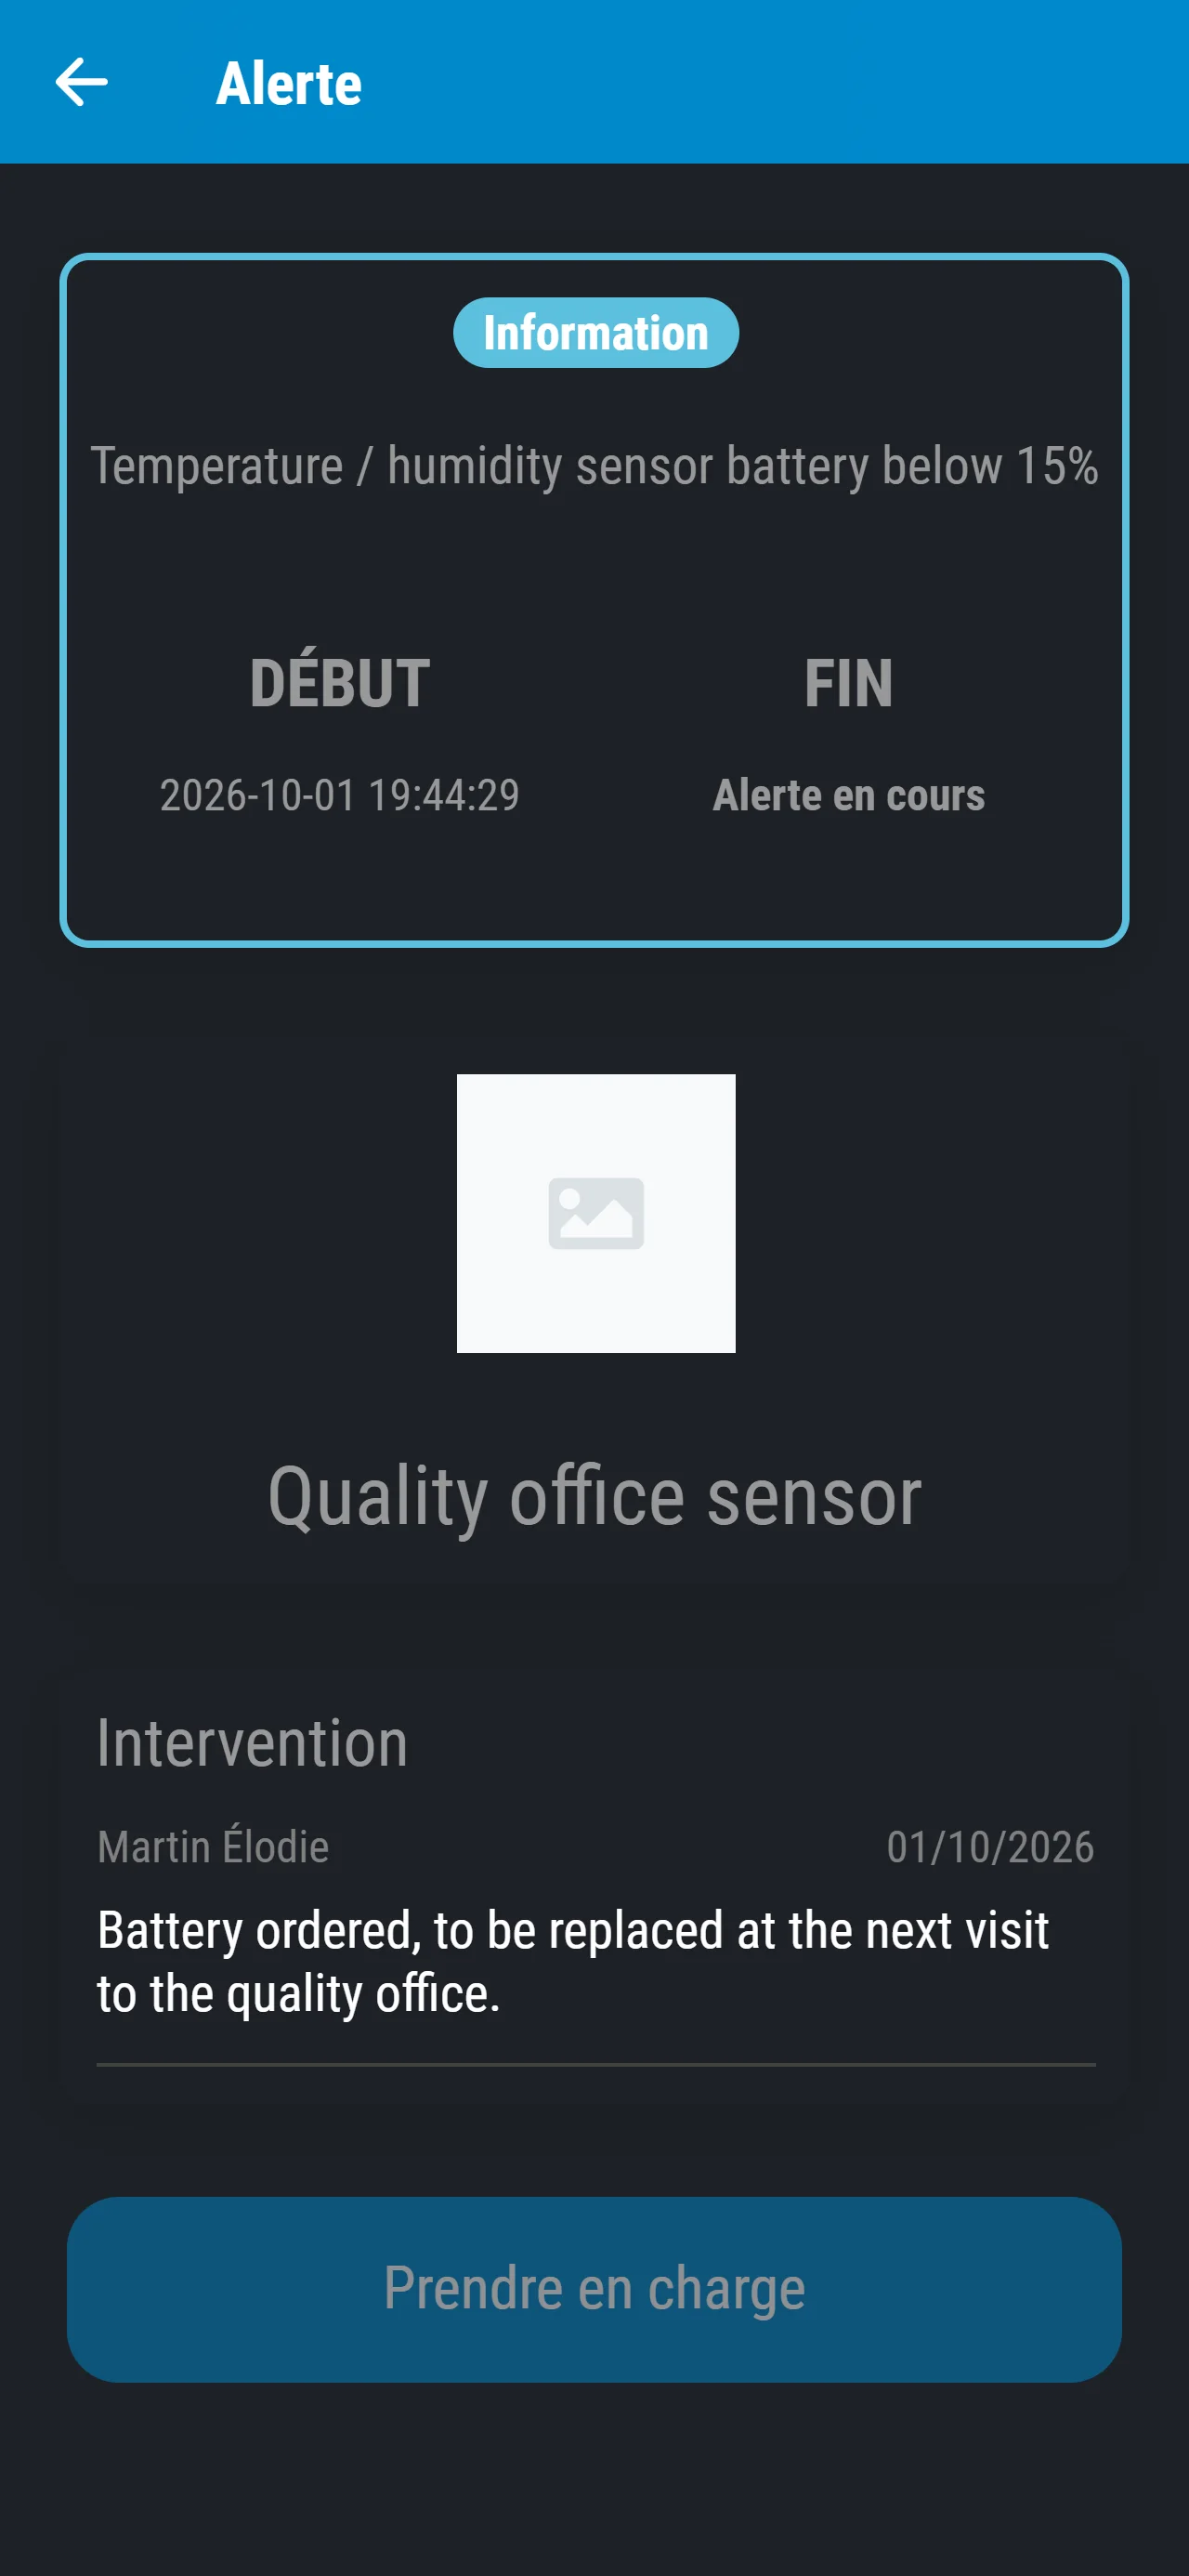
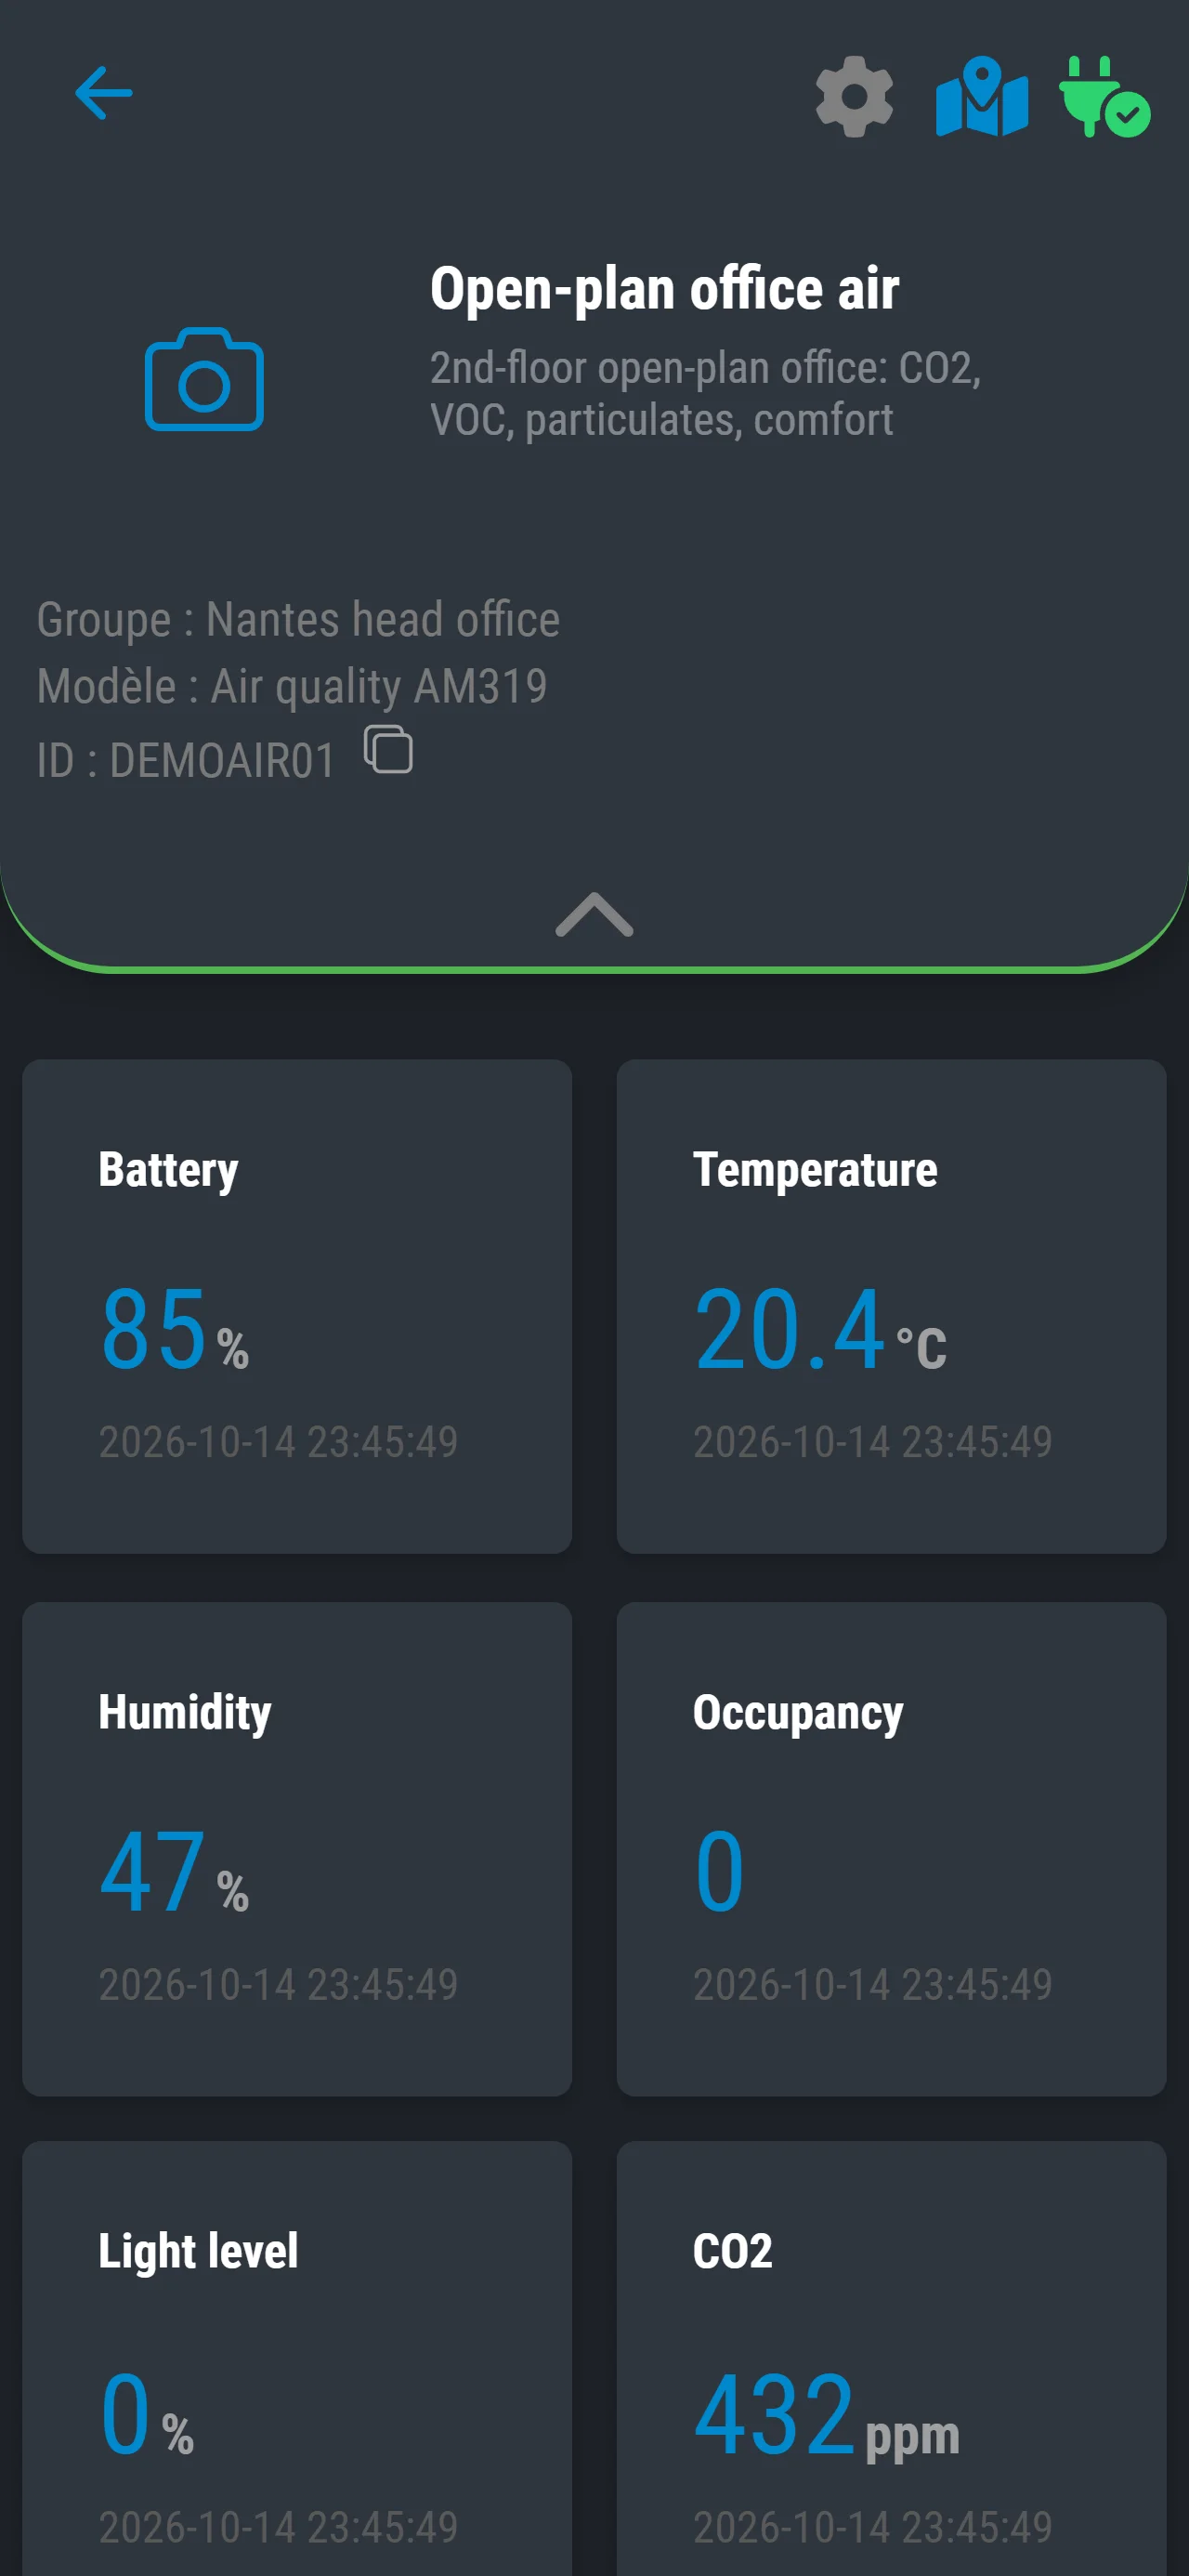
Enlarge the screenshot: The app’s Alerts screen, closed alerts tab: three alerts edged in the colour of their severity, two on cold room 2 (temperature and door), with a photo of its probe, dealt with by Camille Durand, and a water leak in the technical room dealt with by Thomas Bernard, each with its start and end Enlarge the screenshot: Details of an ongoing alert in the app: a probe’s battery level below 15% (Information) on the quality office sensor, acknowledged by Élodie Martin with the message “Battery ordered, to be replaced at the next visit to the quality office.” Enlarge the screenshot: The page for the open-plan office air sensor in the app: group, model and identifier, then the latest readings for battery, temperature, humidity, occupancy, light level and CO₂
The mobile app: the alert history, an alert acknowledged with a message, and a sensor’s page (demo data)

Teams & organisations

Designed for teams, on one site or several

Everyone has their own account and permissions. You organise your devices by site, and the administrator stays in control of everyone’s permissions.

  • You decide who does what

    The administrator creates the accounts for their team, and each person receives an email to choose their password. The administrator ticks each person’s permissions: administer, add devices, manage alert rules, choose who is notified, access developer features. They also choose which business applications each person can use, and can deactivate an account.

    All users see the company’s devices: permissions cover what each person can do.

  • Several sites, one view

    Your groups, by site or by use, filter your lists and target alert rules and the sending of alert messages. Zones drawn on the map also organise your devices by site, then by building.

  • Your space, your devices

    Each customer has their own space, and the account administrator sets each user’s permissions. If you go through a reseller, you decide whether they can see your devices.

  • An administrator area

    The administrator follows the statistics for their devices and finds their documents in one place.

Sign-in

One profile per person, with two-factor authentication if you choose

Each user manages their contact details for alerts (email, text message, phone), dark mode and their password.

On the web portal, anyone can turn on two-factor authentication: each time they sign in, they also enter a code given by an app on their phone.

Your data and security

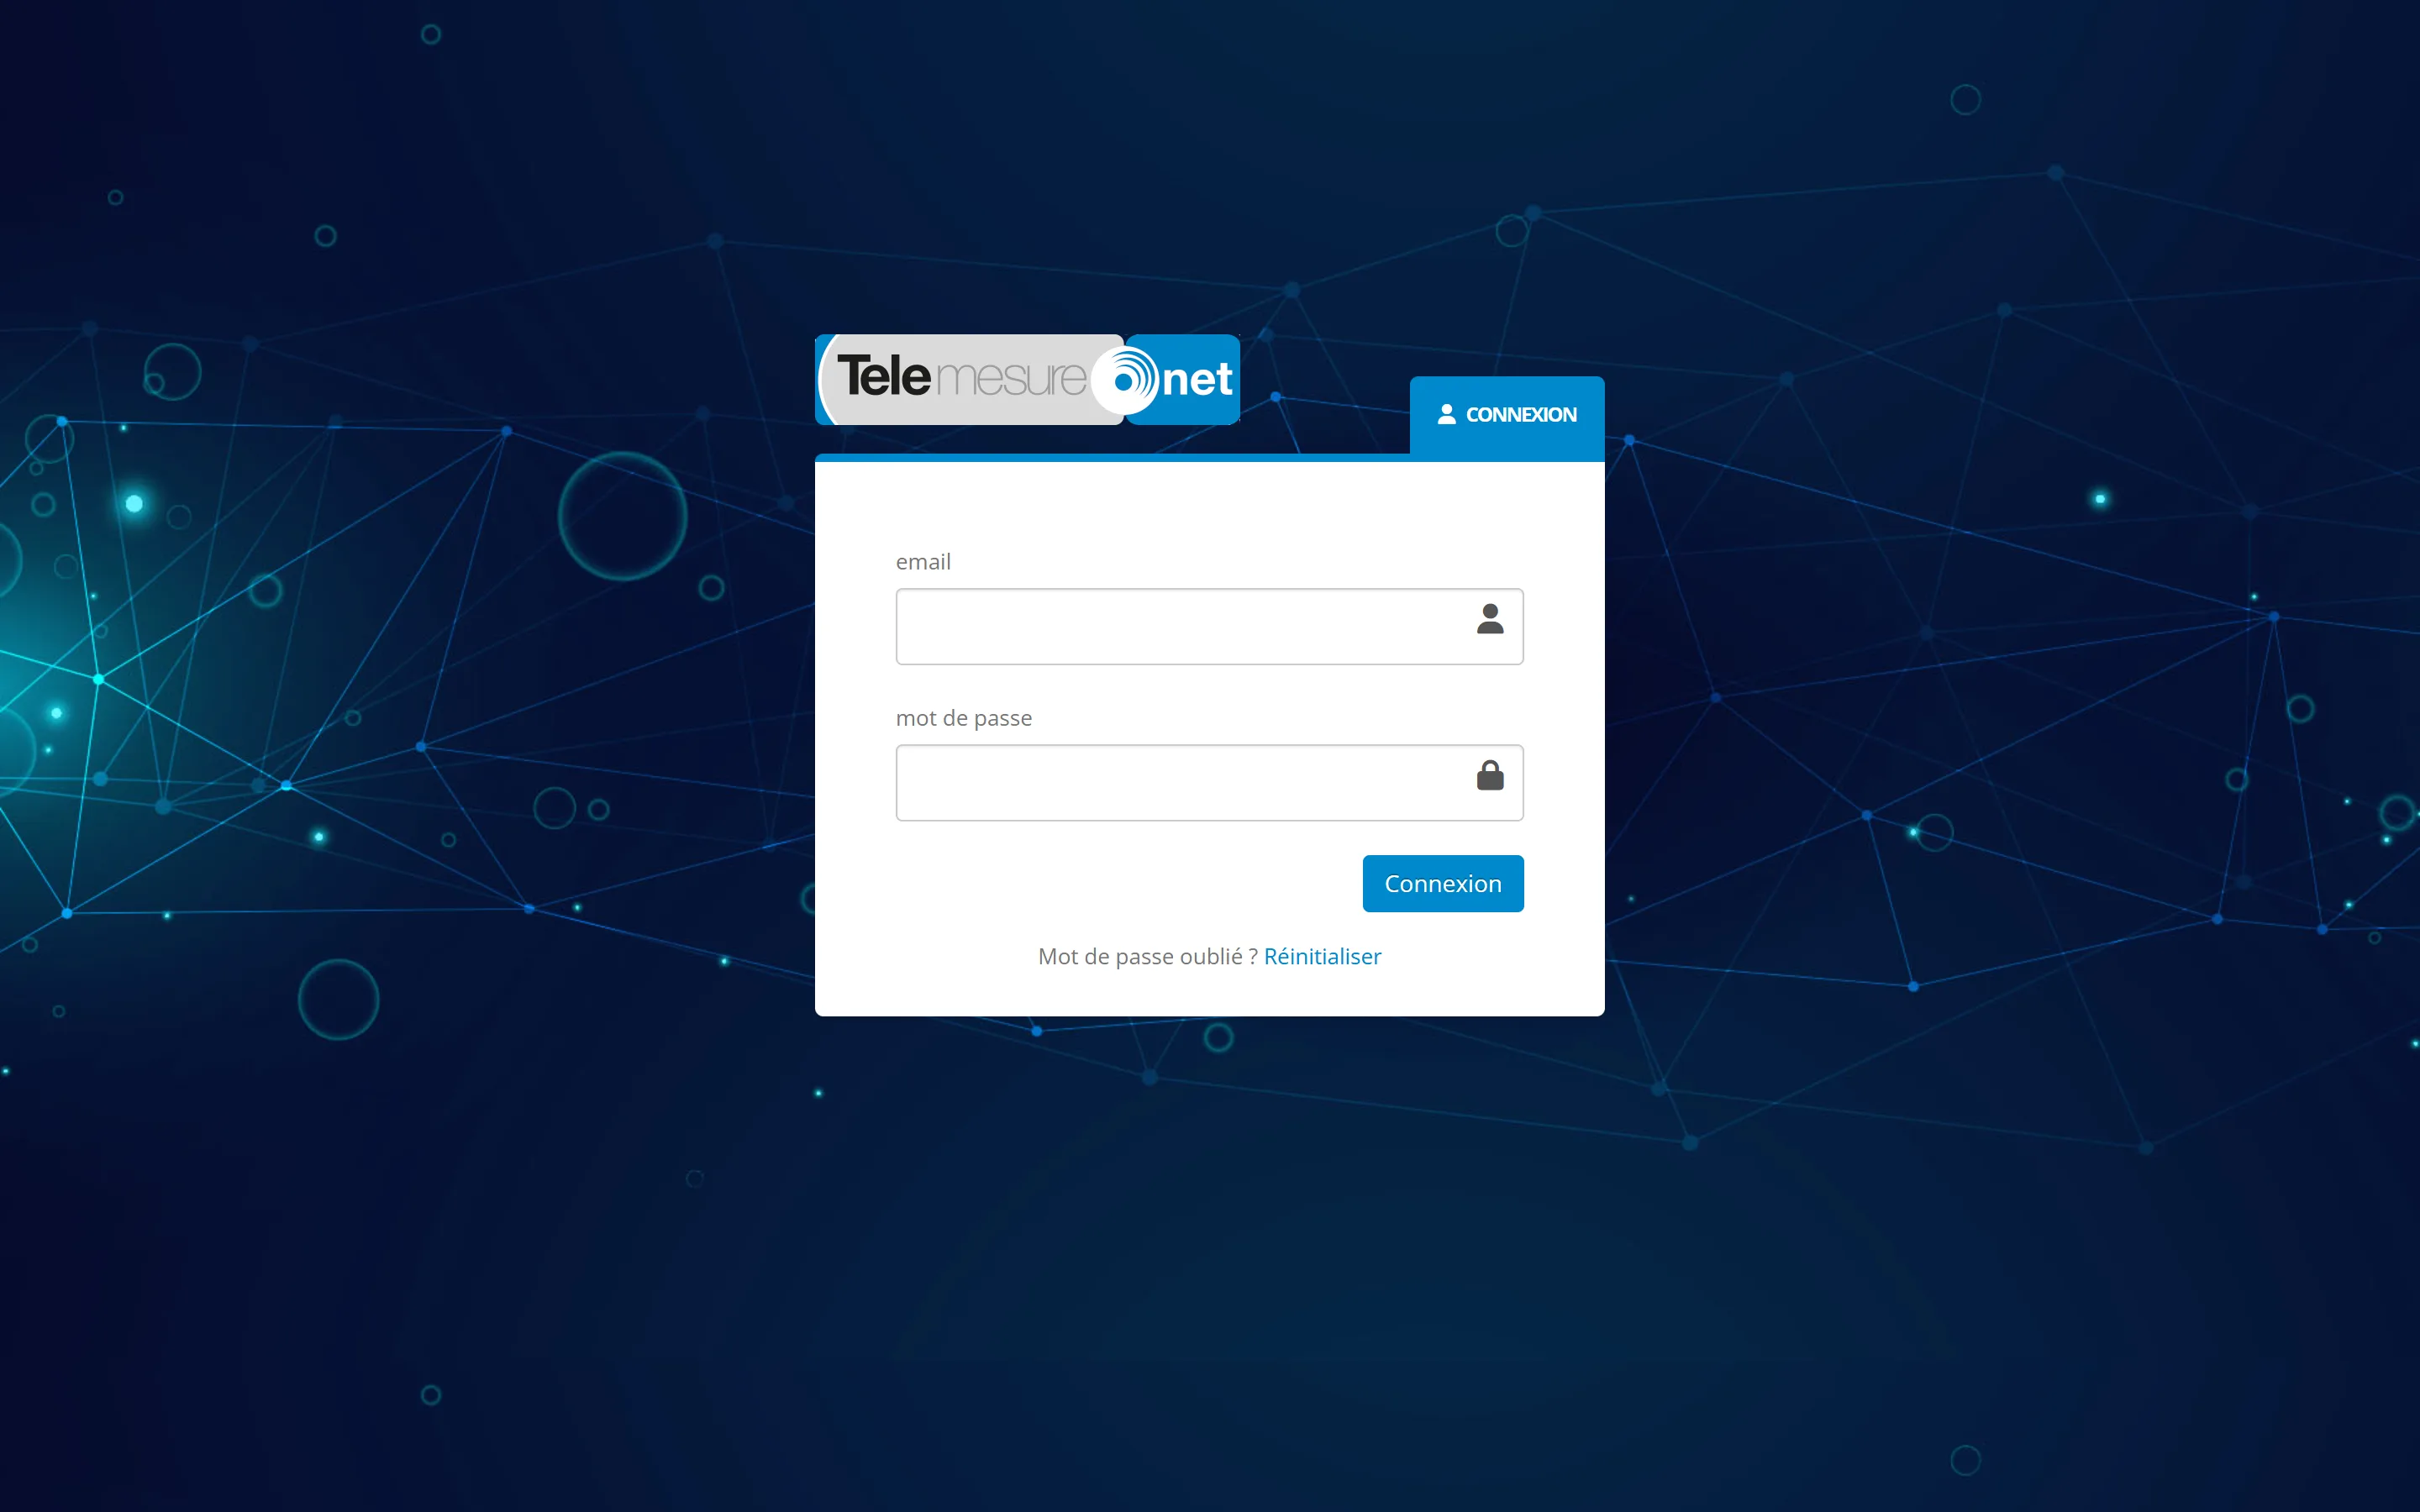
Enlarge the screenshot: The Telemesure portal sign-in page: logo, empty email and password fields and a Sign in button, on a midnight-blue background
The portal sign-in page: everyone signs in with their own account (demo data)

Manufacturers & distributors

Offer connected products without building your own platform

Telemesure can power your own products: activation by code, a reseller area, and a portal or app in your own colours, built with our team.

  • Your portal or app, in your own colours

    This is what is known as “white label”. Your customers sign up on your portal by themselves, add a device with its code and control it remotely. The portal has its own legal notice. A mobile app under your brand can also run on Telemesure.

  • Products ready to activate

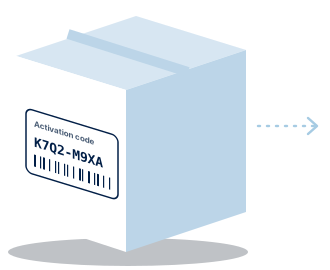
    Each product can be given a unique 8-character activation code, linked to its settings and its network connection. You can print it on the label: your customer then activates the product themselves with this code.

  • A reseller area

    The reseller creates their customers’ accounts and manages their users. They see their customers’ devices, assign activation codes and see which ones have been used.

  • Custom development

    Our team can integrate a new device, or create a dedicated settings screen or an analysis screen for a specific customer, such as the occupancy rate of premises. These screens were designed for specific customers: they show what our team can build with you.

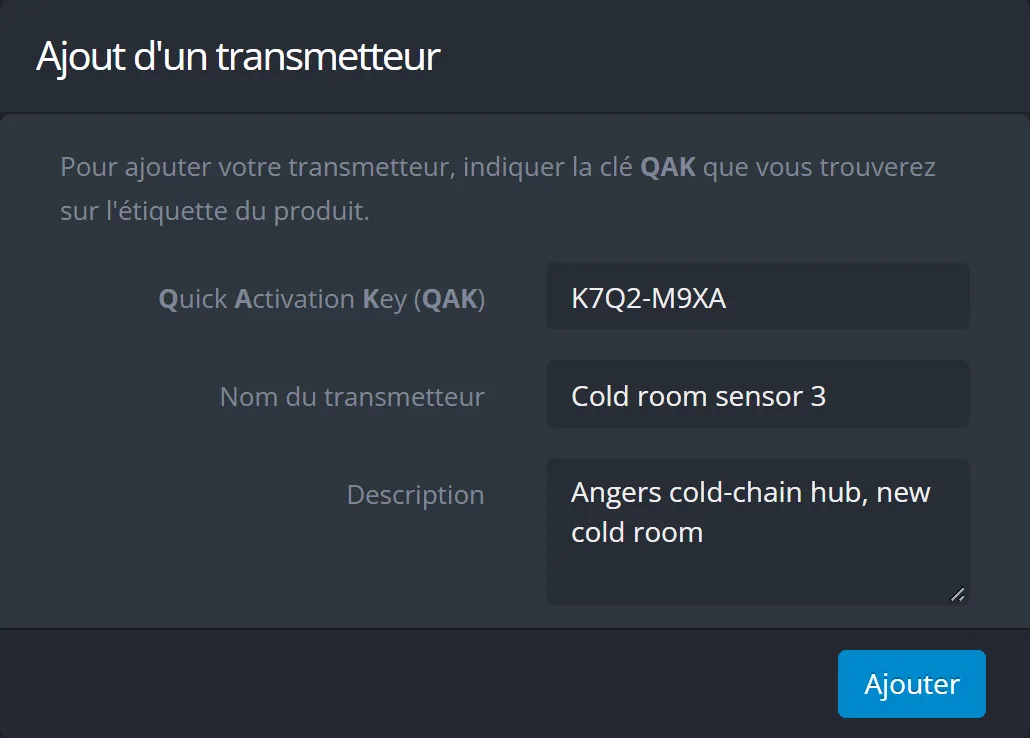
Illustration: a product with an 8-character activation code on its label. Enlarge the screenshot: The portal’s “Add a transmitter” panel: activation key K7Q2-M9XA read from the product label, the name “Cold room probe 3”, a description and an Add button
The code from the label, entered in the Telemesure portal. A portal in your own colours offers the same screen (demo data)

Two real-world examples, two sectors

A manufacturer of air purifiers and a manufacturer of electric fence energisers already rely on Telemesure for their own products. We look at each project with you: let’s talk about yours.

Tools and business applications

Tools to go further

The portal also brings these tools together. The administrator chooses which users can access them.

  • ZonesYour sites and buildings drawn on the map

  • Automatic reportsPDF reports sent by email

  • Data exportSeveral devices in a single export

  • Data APIYour readings, read by your software

  • Remote updatesThe software of compatible devices

  • Stock managementProducts, locations and movements

  • InterventionsPlan and track work in the field

  • Cabinet accessTechnicians’ opening codes

  • Private gatewaysThe status of your LoRaWAN gateways

Complete business applications

For some sectors, the portal offers complete applications. We set them up with you.

  • Technical cabinets: technician access

    The manager registers the authorised technicians, one by one or by importing a file, activates or deactivates them, and customises the text message they receive. Technicians get their opening code from their app or, depending on the configuration, by text message, and record their interventions there, with photos. This module is linked to specific hardware.

  • Stock and interventions

    The stock module manages products, locations and movements. The interventions module plans the work (customer, location, technician, priority, equipment to take from stock) and tracks each intervention, from draft to closure. The technician receives their schedule through a link sent by email.

Request a demo

Let’s talk about what you want to monitor

Tell us which equipment and which sites are involved. We look at your needs and show you Telemesure on an example close to yours, with demo data.

Already a customer?

Access your account or ask our team a question.

Support hours: Monday to Friday, 9:00 to 17:30 (Paris time), excluding public holidays.